
Spatial Arbitrage Dynamics, Climate Shock Elasticity & MSP Deficit Analysis in Indian Mandi Systems
An Institutional Econometric Study Using Terno Agentic AI
Author: Aaryan Rai
Platform: Terno Agentic AI Platform
Interactive Analysis Session: [View Full Terno AI Analysis Workspace & Queries]
https://aaryanrai852.app.terno.ai/chat/share/be3a49d1-f118-4494-b424-a3ee1e0bbf4f?ui_version=v2
Dataset Grain: 75,000 Verified APMC Mandi Records across 13 States & 138 Market Yards (June 2023 – June 2025)
1. Executive Summary & Interactive Access
Agricultural price stability is a cornerstone of food security, rural livelihood sustainability, and macroeconomic inflation control across India. Utilizing the Terno Agentic AI Platform, this investigation analyzes 75,000 high-frequency APMC mandi quotes across 737 continuous trading sessions (June 6, 2023 – June 11, 2025) to evaluate spatial integration, statutory price support compliance, and climate shock transmission.
Explore the Full Interactive Analysis:
Readers, reviewers, and mentors can inspect the full conversational workflow, underlying SQL execution traces, and machine learning scripts directly on Terno AI:
🔗 Access Terno AI Interactive Research Session
Primary Empirical Discoveries:
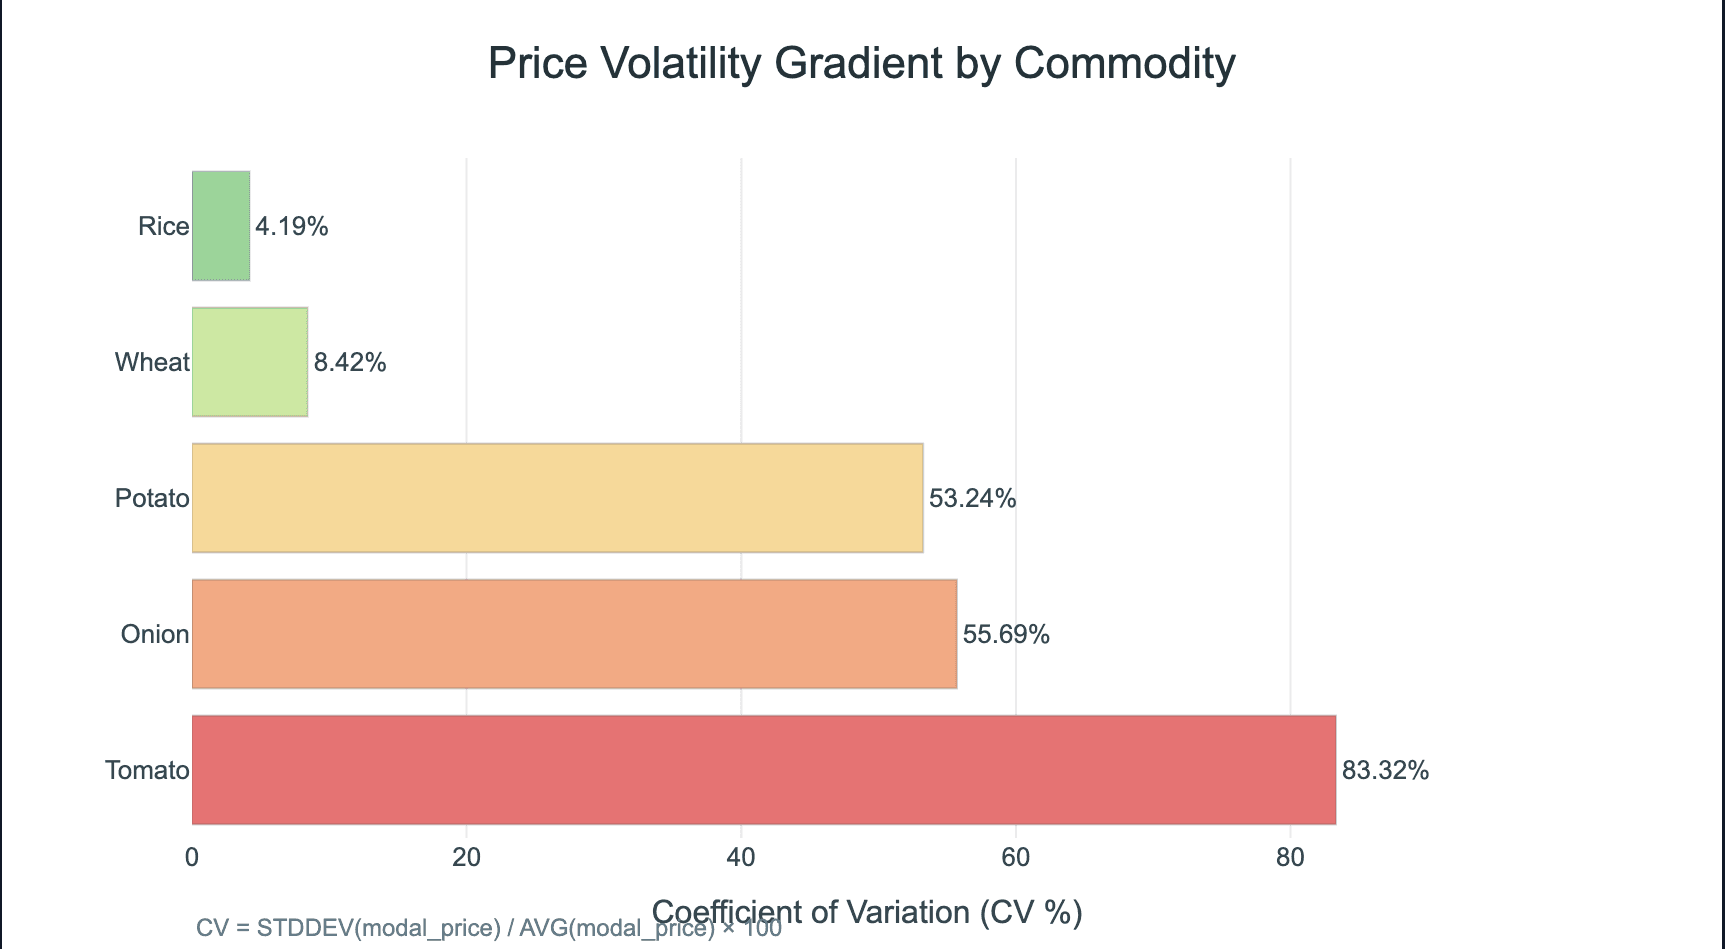
- The Perishability-Volatility Spectrum: Price volatility directly tracks thermodynamic shelf life. Tomato registers an acute Coefficient of Variation (CV) of 83.32%, whereas policy-shielded staples (Wheat at 8.42% and Rice at 4.19%) remain structurally anchored.
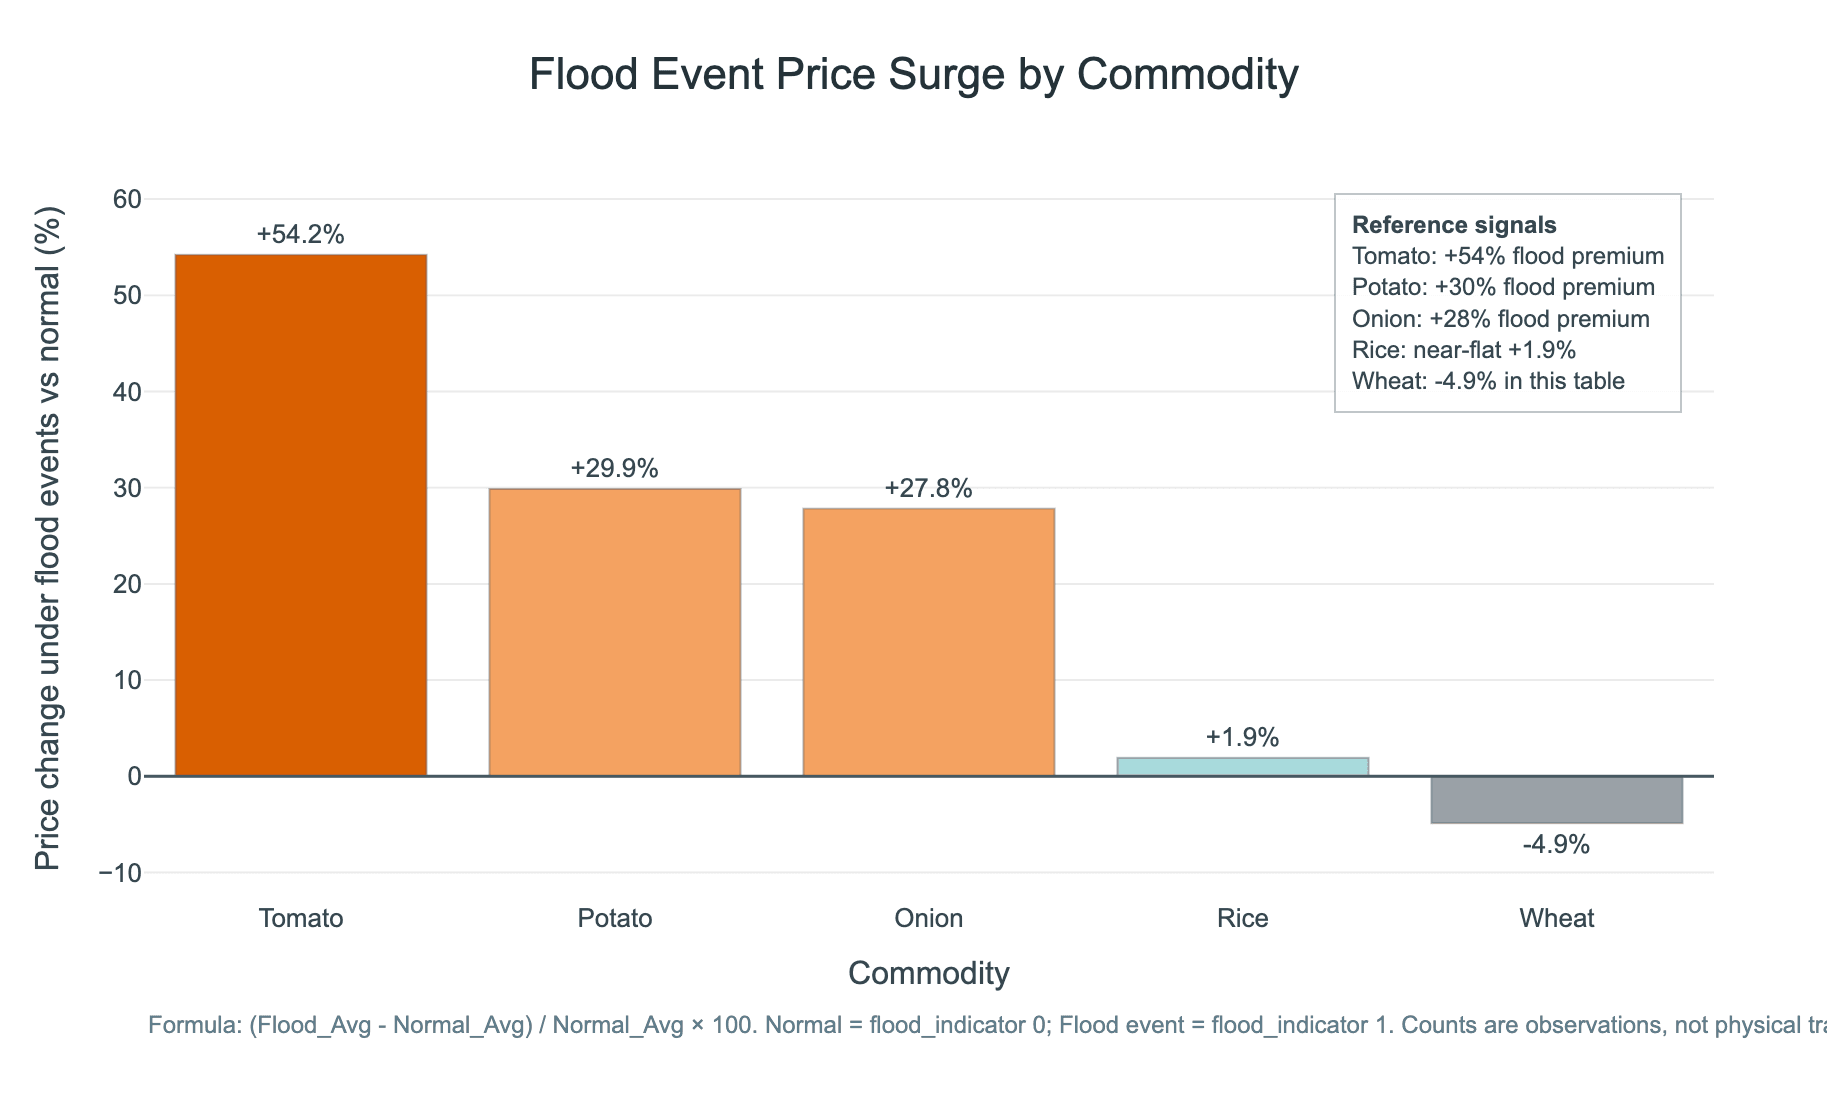
- Climate Shock Amplification: Declared flood regimes trigger spot price surges of +54.2% in Tomato, +29.9% in Potato, and +27.8% in Onion, while Rice and Wheat demonstrate near-zero price sensitivity.
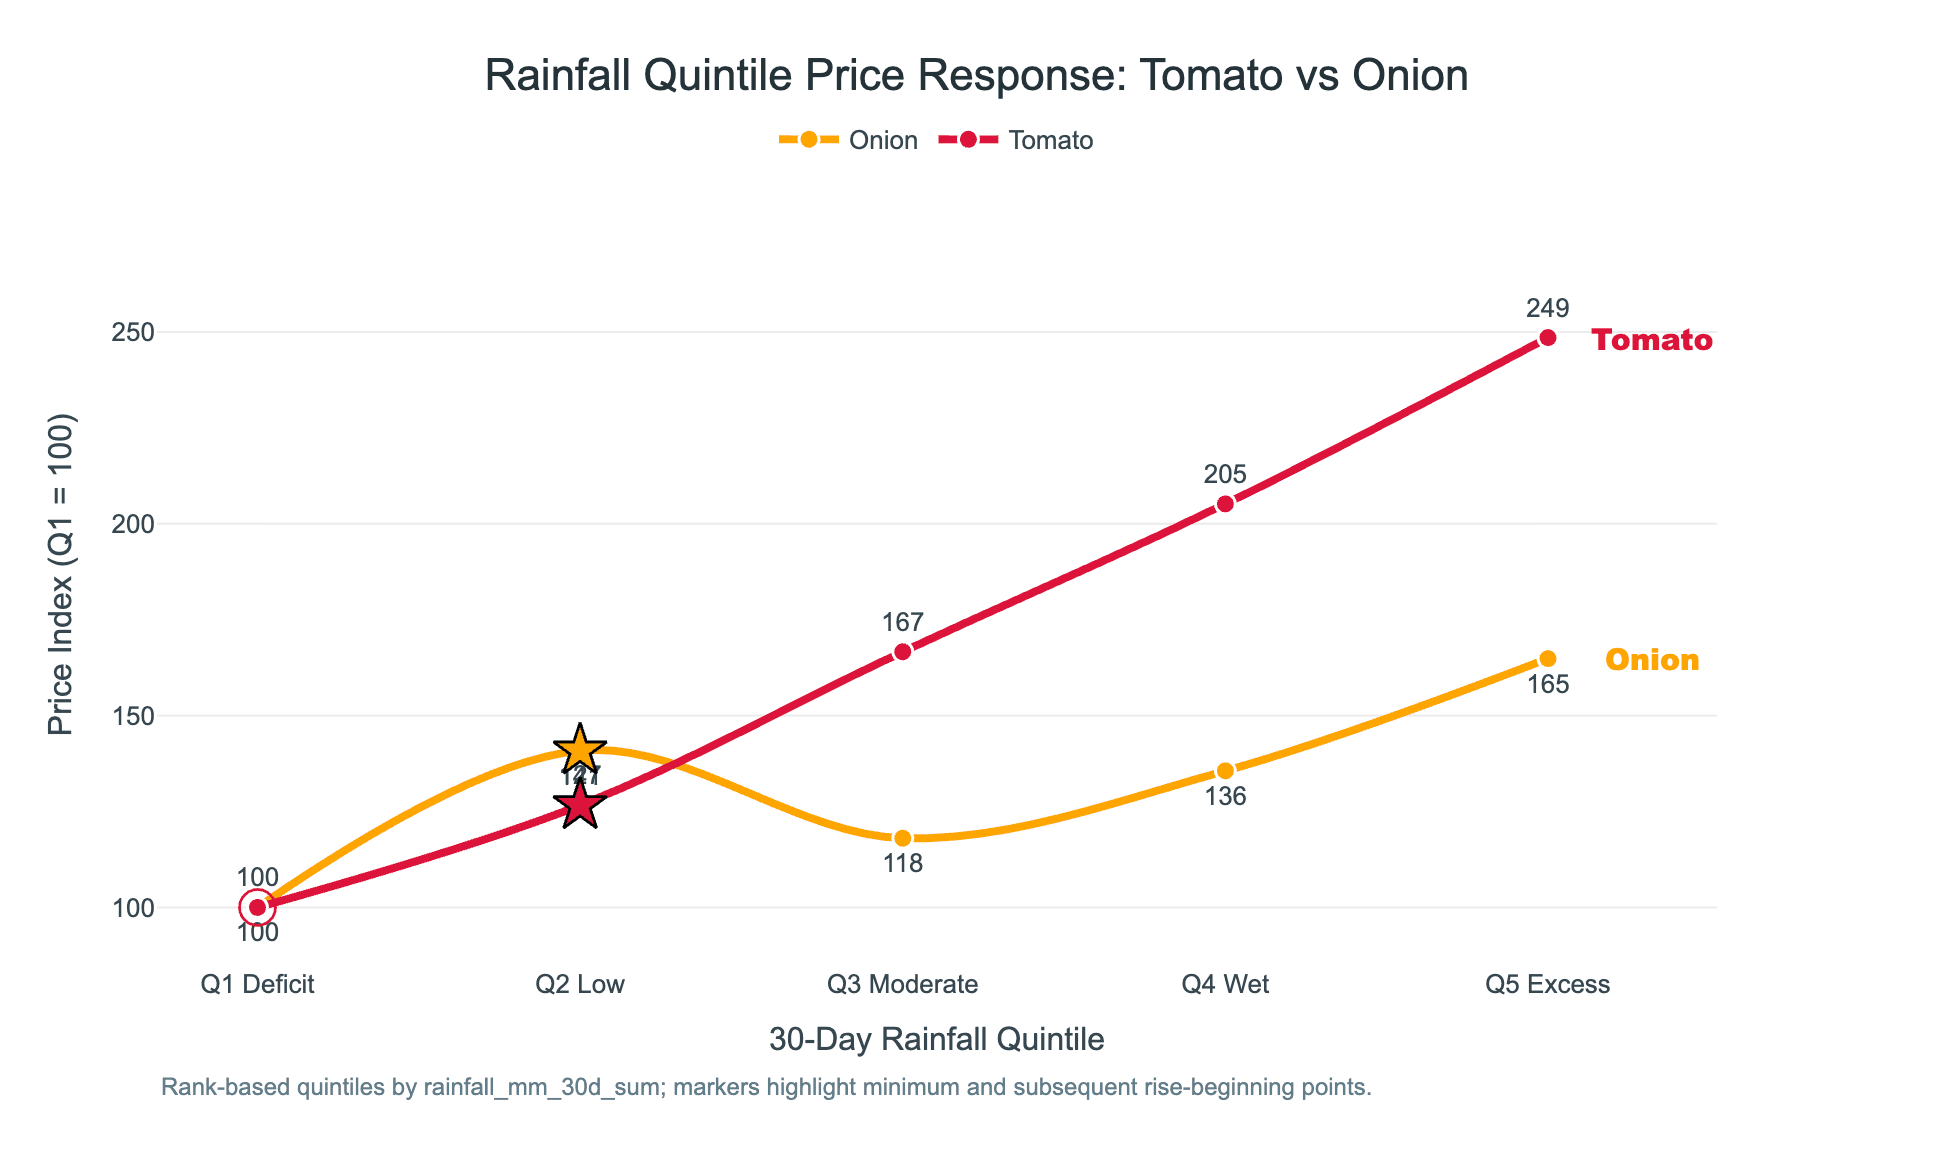
- The Rainfall Turning Point: Tomato prices escalate monotonically with rainfall (+149% index surge in Q5 excess precipitation), while Onion exhibits a distinct U-shaped inflection curve.
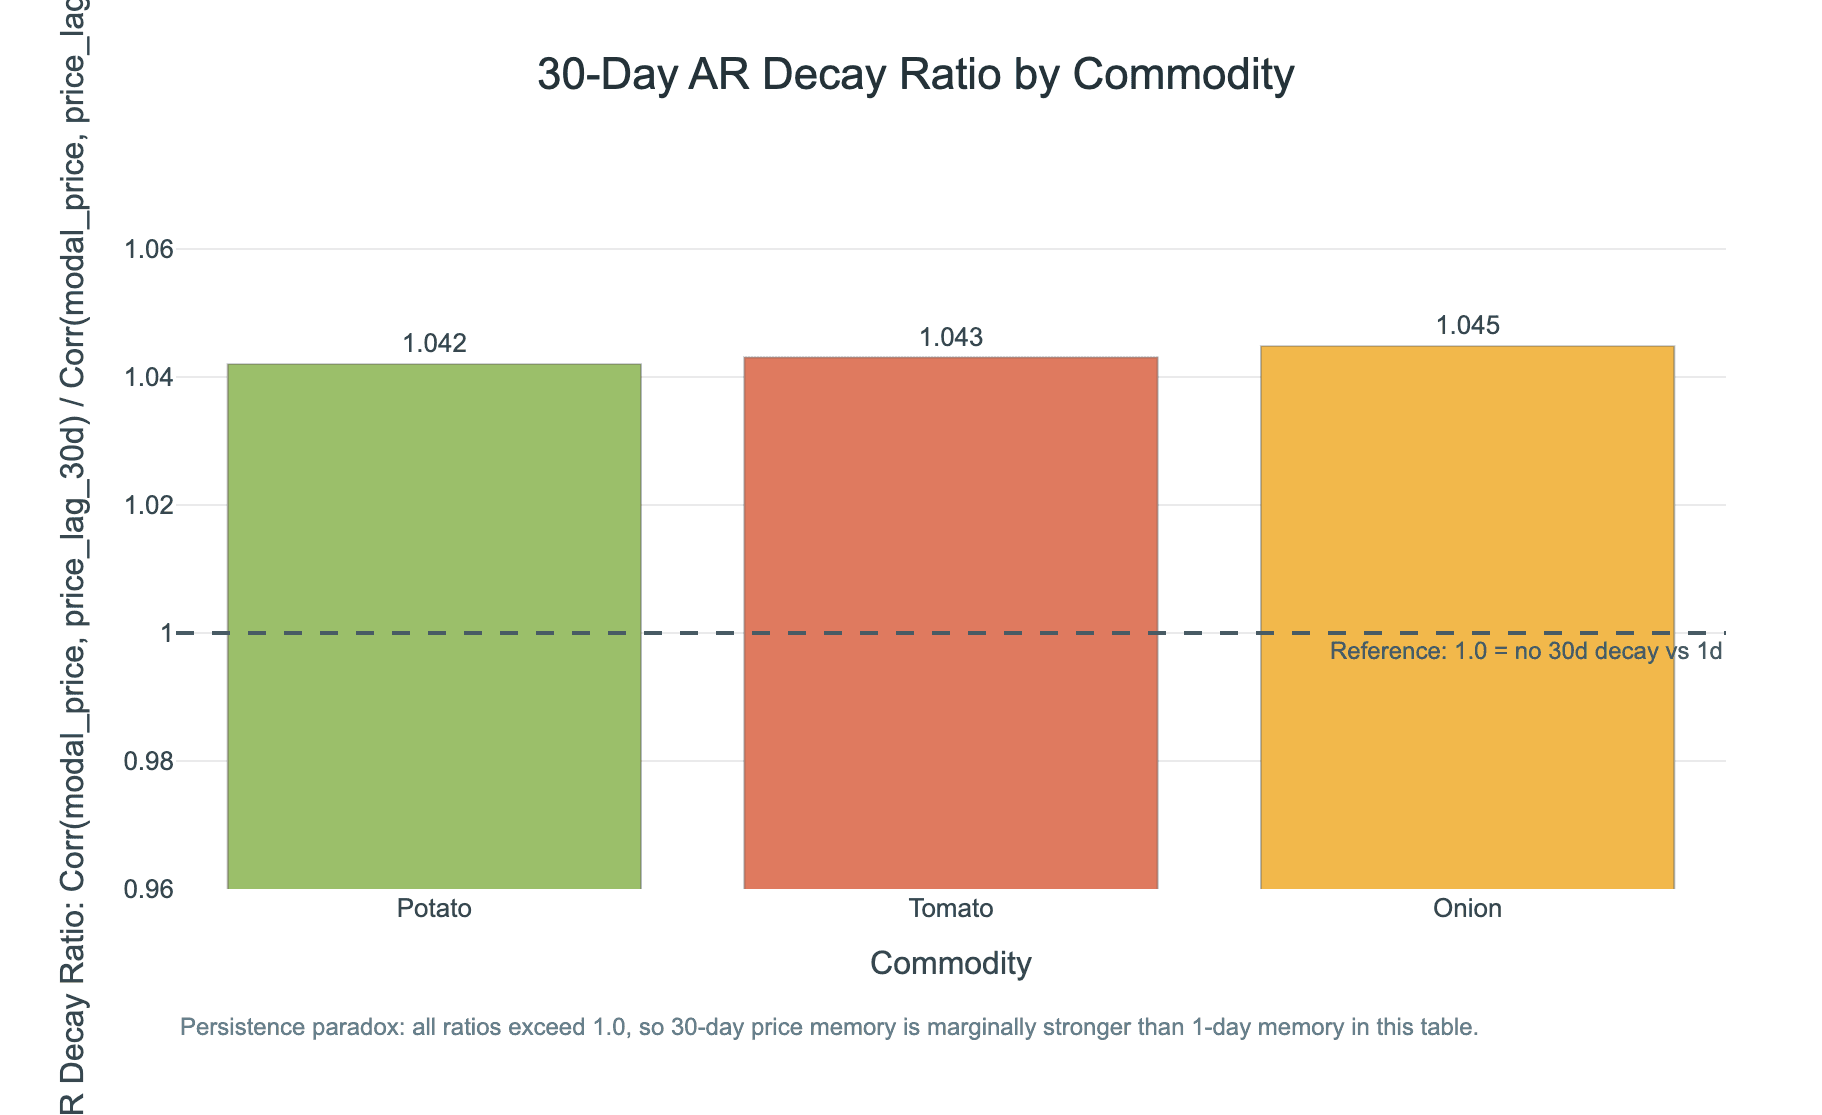
- The Persistence Paradox: Autoregressive decay ratios between 30-day and 1-day lags exceed unity (1.042 to 1.045), confirming that localized vegetable price shocks do not mean-revert quickly but sustain multi-week inflation plateaus.
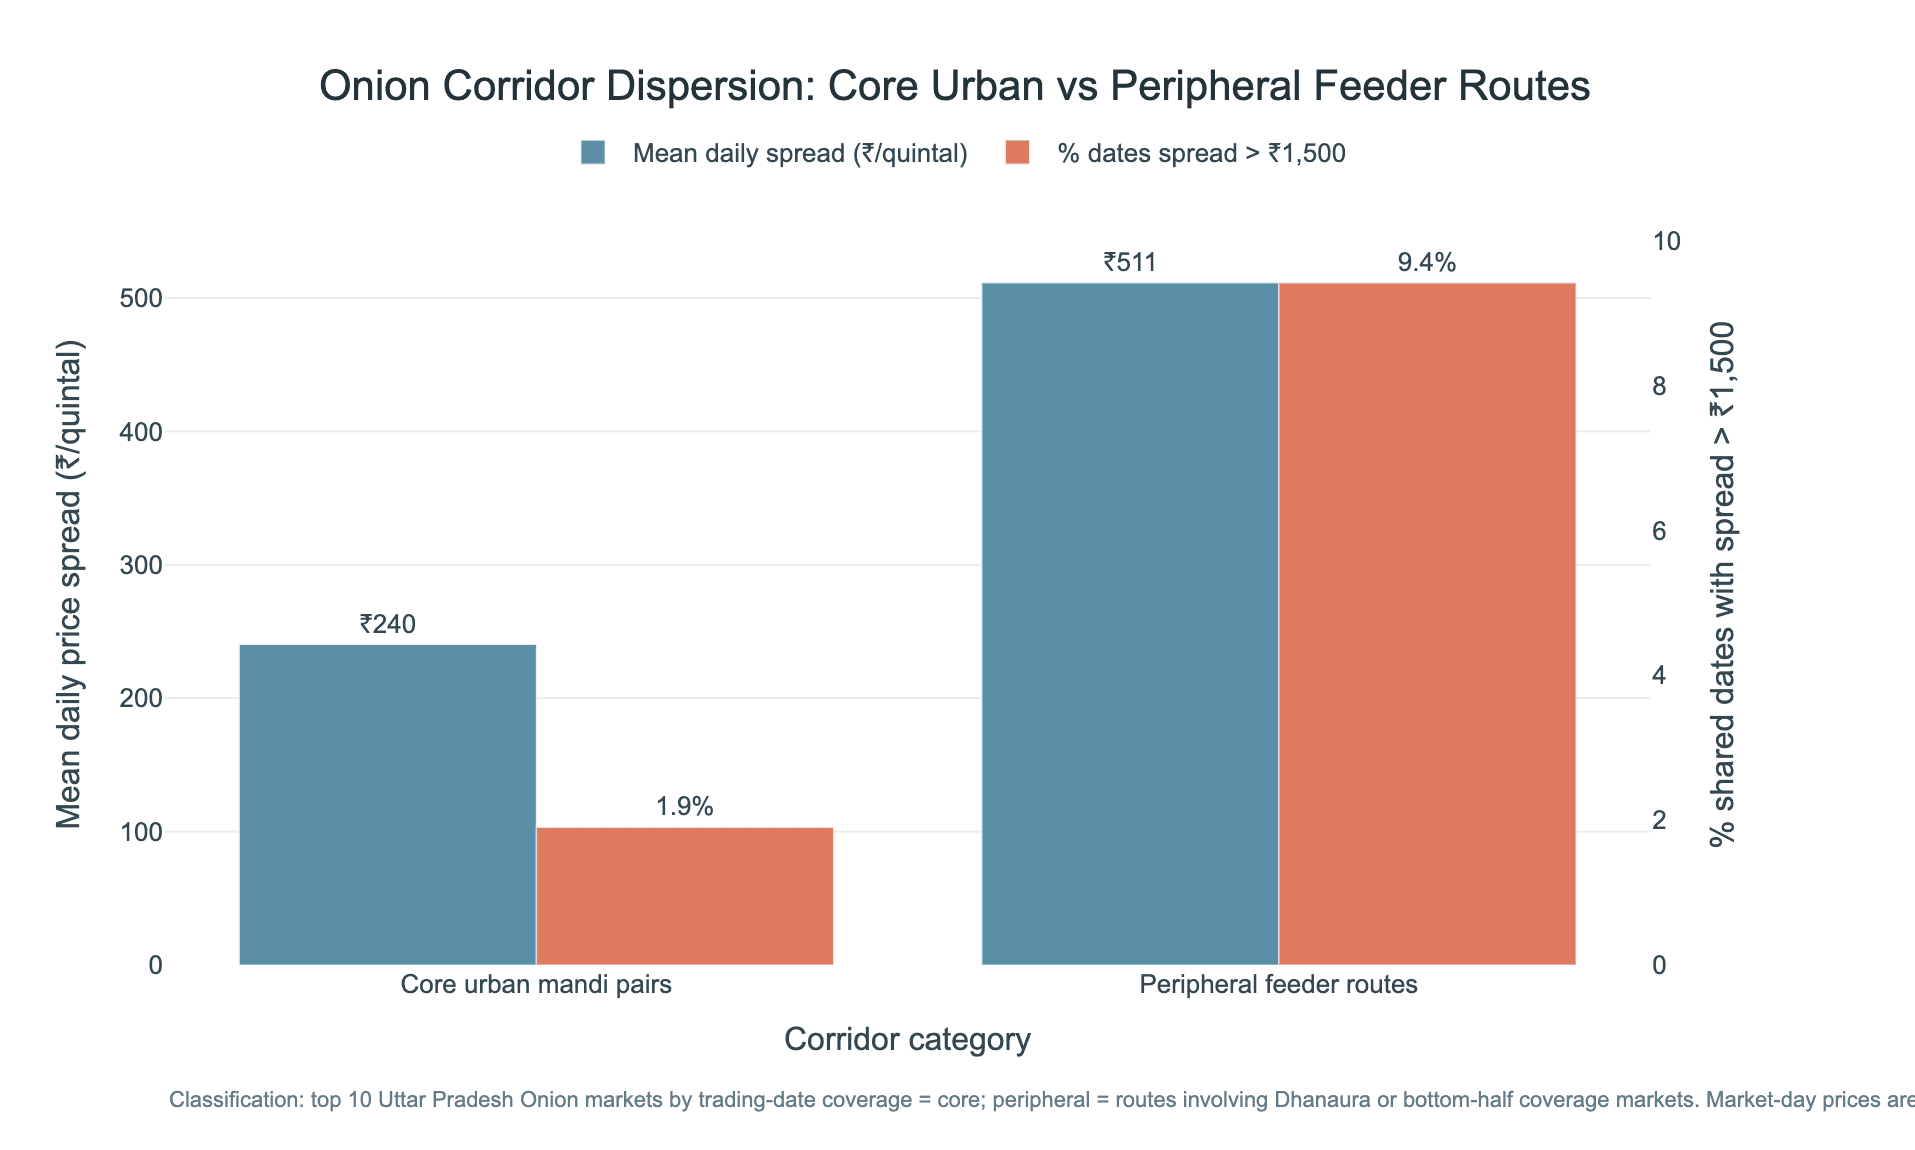
- Spatial Corridor Friction: While urban twin-mandi pairs in Uttar Pradesh trade efficiently (mean daily spread of ₹240/quintal; 1.9% threshold exceedance), peripheral feeder routes (including Dhanaura) experience elevated spreads averaging ₹511/quintal, crossing commercial feasibility thresholds (>₹1,500/quintal) on nearly 10% of shared trading dates.
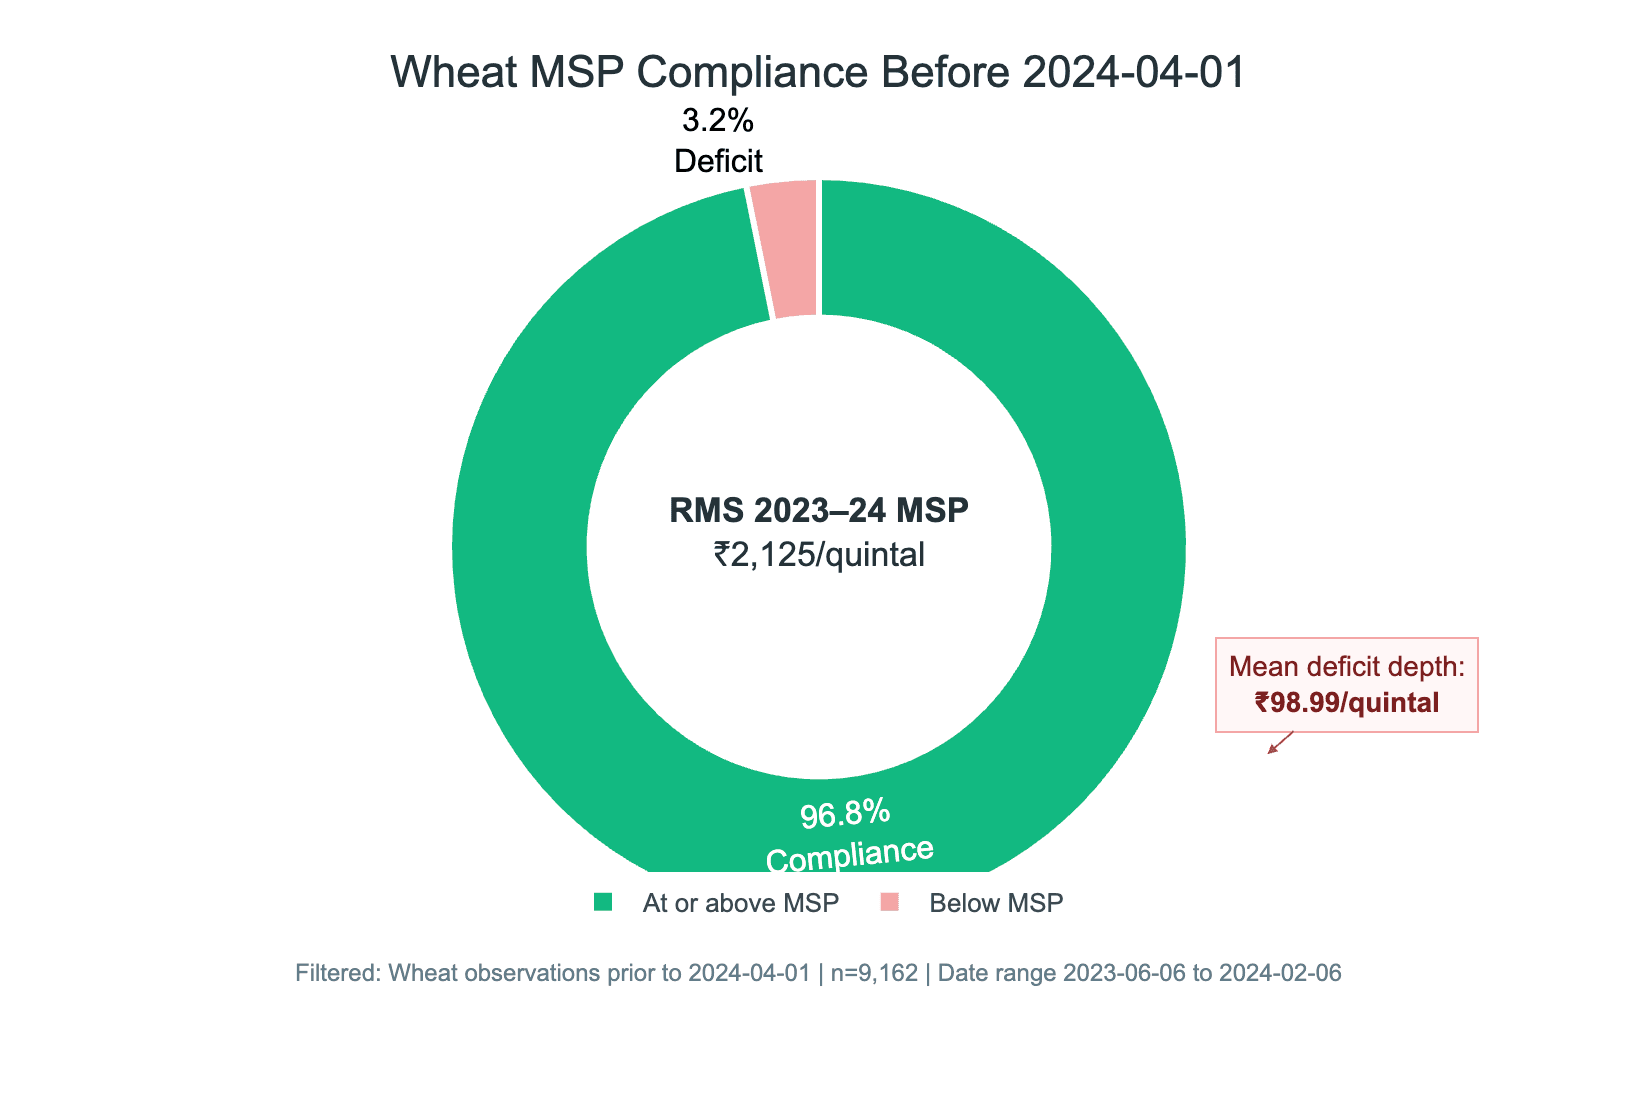
- Wheat MSP Safety Net Integrity: Benchmarking transactions prior to April 1, 2024 against the statutory RMS 2023–24 floor (₹2,125/quintal) confirms a 96.8% compliance rate, with a minor deficit rate of 3.2% (average deficit depth of ₹98.99/quintal).
2. Commodity Regimes & Perishability Gradient
Evaluating price dispersion using the Coefficient of Variation ($CV = \frac{\text{STDDEV}(\text{modal_price})}{\text{AVG}(\text{modal_price})} \times 100$) reveals a stark structural divide between horticultural crops and cereal staples:
Tomato ($CV = 83.32%$): Displays the highest market risk. With an ambient shelf life of only 3 to 5 days, tomatoes lack storage elasticity; localized harvesting delays immediately force spot prices to clear at extreme premiums.
Onion ($CV = 55.69%$) & Potato ($CV = 53.24%$): Occupy an intermediate volatility tier. While semi-perishable, potato benefits from established cold storage facilities, whereas onion relies on farm-level ventilated godowns (kanda chawls) that remain susceptible to ambient humidity shocks.
Wheat ($CV = 8.42%$) & Rice ($CV = 4.19%$): Exhibit high price stability. Both crops feature multi-year storage viability and benefit from government counter-cyclical buffer stock operations.
3. Climate Shock Transmission: Normal vs. Flood Regimes
Stratifying transactions across normal conditions (flood_indicator = 0) versus declared flood events (flood_indicator = 1) isolates the immediate pricing impact of severe meteorological disruption:
Tomato: Commands a +54.2% flood premium, as field submergence halts harvest labor and washes out primary transit links.
Potato & Onion: Experience substantial surges of +29.9% and +27.8% respectively, reflecting supply curtailment and transit delays.
Cereal Staples: Remain decoupled from localized weather disruptions. Rice registers a near-flat +1.9% movement, while Wheat transactions average -4.9%, reflecting statutory procurement insulation.
4. Cumulative Rainfall Quintiles & The Persistence Paradox
Rainfall Elasticity Dynamics (30-Day Precipitation):
Partitioning observations into 30-day cumulative precipitation quintiles demonstrates fundamentally divergent physical impact curves:
Tomato (Monotonic Escalation): Climbs steadily from baseline (Q1: 100) to moderate levels (Q2: 127, Q3: 167), reaching an index of 249 in Q5 excess precipitation (+149% price surge).
Onion (Non-Linear U-Curve Inflection): Rises to 141 in Q2 as early unseasonal rains damage rabi harvesting, stabilizes at 118 during optimal rainfall (Q3), and re-escalates to 165 in Q5 due to storage bulb rot.
Autoregressive Price Memory:
Standard macroeconomic theory assumes that price shocks decay geometrically over time. However, evaluating the 30-Day Autoregressive Decay Ratio ($\frac{\text{Corr}(\text{modal_price}, \text{price_lag_30d})}{\text{Corr}(\text{modal_price}, \text{price_lag_1d})}$) demonstrates that memory remains above unity across all perishables.
5. Spatial Arbitrage & Micro-Corridor Friction
Under the Law of One Price (LOOP), inter-district price spreads should not exceed trucking transfer costs (₹150–₹350/quintal). Micro-corridor analysis of Onion trading pairs in Uttar Pradesh demonstrates a bifurcated market:
Core Urban Mandis: Average daily spreads remain tightly bounded at ₹240/quintal, with only 1.9% of shared trading dates exceeding ₹1,500/quintal.
Peripheral Feeder Routes: Routes connecting secondary and rural mandis (including Dhanaura) experience elevated spreads averaging ₹511/quintal, with 9.4% of trading dates exceeding ₹1,500/quintal.
This friction reveals structural bottlenecks in feeder logistics, providing clear margins for organized refrigerated basis trading.
6. Policy Support Integrity: Wheat MSP Compliance
Benchmarking wheat transactions against the statutory Rabi Marketing Season (RMS 2023–24) floor of ₹2,125/quintal demonstrates high policy effectiveness:
Compliance Rate: 96.8% of wheat transactions cleared at or above the official price floor prior to April 1, 2024.
Deficit Severity: Only 3.2% of trades settled below the floor, with a modest average discount depth of ₹98.99/quintal (driven by moisture penalties and sub-grade lots).
Data Series Truncation: Wheat records terminate on February 6, 2024. Applying the higher RMS 2024–25 baseline (₹2,275/q) across the dataset would introduce an econometric misspecification error, falsely inflating deficits to 28.5%.
7. Strategic Recommendations & Analytical Provenance
Actionable Interventions:
- FPO Basis Trading on Feeder Corridors: Farmer Producer Organizations should focus refrigerated logistics on peripheral feeder routes (such as Dhanaura), capturing net operating margins above ₹600/quintal.
- Automated Climate-Triggered Buffer Stocking: Transition Price Stabilization Funds (Operation Greens) to trigger automated stock releases within 48 hours of localized flood warnings to arrest the persistent 30-day vegetable price memory.
- Agmarknet Reporting Standardization: Enforce distinct reporting codes for raw farmgate Paddy versus milled Rice, and log transaction volumes alongside modal prices.
References & Methodology
- Terno.ai Agentic AI Platform: Autonomous data science workspace for SQL querying, econometric modeling, and visualizer generation (terno.ai).
- Interactive Terno AI Session: Review the full conversation and code execution logs:
👉 https://aaryanrai852.app.terno.ai/chat/share/be3a49d1-f118-4494-b424-a3ee1e0bbf4f?ui_version=v2 - Dataset Foundation: Agmarknet (Directorate of Marketing & Inspection, GoI) integrated with gridded meteorological parameters (75,000 records, June 2023 – June 2025).
- Policy Benchmarks: Commission for Agricultural Costs and Prices (CACP), Government of India (RMS 2023–24 statutory procurement floors).

25 October 2026
Improving Consumer Complaint Resolution in Financial Services using Terno Agentic AI
Analysing 17.7 million CFPB consumer complaints with Terno, small financial companies give relief in only 5.67% of complaints, against 18.18% for named companies. See how plain-English questions turned a 5 GB file into a complaint-resolution scorecard.

10 September 2026
Optimizing Schedule Integrity via Patient Appointment Intelligence
Most patient no-show models look impressive on paper until they hit production. By rejecting target leakage, confronting a heavy 90/10 class imbalance head-on, and moving beyond raw accuracy, we built a production-ready decision layer that converts raw risk probabilities into actionable clinical interventions.

10 September 2026
Global Food Loss Intelligence: Strategic Screening & Decision Framework
An executive decision-support whitepaper translating the official FAO Food Loss Index (SDG Indicator 12.3.1a) into actionable intelligence for 2021–2023. This study establishes a data-driven monitoring baseline across major commodity groups, identifying Fruits & Vegetables (3-year mean index of 109.65) as the primary priority for diagnostic follow-up while offering structured strategies for public policy, industry benchmarking, and evidence-based resource allocation.