
Multi-Modal Social Media Analytics for Global Mental Health Assessment using Terno AI
A predictive modeling and data-driven approach to predict degrading mental health
Disclaimer: This is a purely data science study based on publicly available datasets. Any relation found with the real world is unintentional and coincidental. The maker or evaluator of this report holds no responsibility.
Abstract
Mental health disorders — including depression, anxiety, and suicidal tendencies — pose a significant global public health challenge. This study integrates multi-modal datasets from social media and global suicide statistics to identify patterns of mental health risk at both the individual and population levels.
Five publicly available datasets, comprising sentiment-labeled posts, emotion-detection data, suicide-classification corpora, and Twitter-based mental health posts, were combined into 20,000 high-quality, curated data points suitable for robust analysis. Both a manual Python-based pipeline and the TernoAI agentic data analysis platform were used to perform feature extraction, risk scoring, behavioral analytics, and visualization.
Key behavioral metrics — post frequency, engagement, follower count, post length, and temporal posting patterns — were analyzed alongside linguistic cues from post content. Users were then probabilistically mapped to countries, age groups, and generational cohorts using global suicide statistics.
Key result: Young adults (15–24 years) and males exhibit higher risk scores, with high-risk linguistic markers and engagement patterns clearly identified. TernoAI was shown to enhance pattern recognition, analytical efficiency, visualization quality, and interpretability — highlighting its potential to support early detection, monitoring, and intervention strategies for mental health.
1. Introduction
Mental health disorders — depression, anxiety, and suicidal ideation — have become a major global public health concern, affecting millions across all demographic groups (WHO, 2022). Traditional assessment methods such as clinical interviews, surveys, and self-reported questionnaires often suffer from limitations in scale, timeliness, and objectivity.
Social media has emerged as a rich, largely untapped source of data for mental health research. Platforms like Twitter and Reddit give people a place to express emotions, share experiences, and discuss mental health challenges in real time — capturing both linguistic and behavioral signals of psychological states.
This study takes a multi-modal, multi-dataset approach, integrating:
Social media posts (mostly Twitter)
Emotion-labeled corpora
Global suicide statistics
Twitter was chosen as the primary platform because of its public nature, high volume of real-time data, and self-forming communities that allow open discussion of sensitive topics.
Research Objectives
- Identify linguistic, behavioral, and engagement-based indicators of mental health risk, particularly suicidal tendencies, from social media posts.
- Curate and combine multiple public datasets into a robust dataset suitable for multi-modal analysis.
- Analyze top-risk individuals for demographic characteristics — gender, age group, and potential country of origin.
- Compare analytical efficiency and output quality between the TernoAI platform and manual Python-based data analytics.
- Visualize insights through charts, word clouds, and interactive world maps.
2. Datasets Used
Five publicly available datasets (sourced from Kaggle) were combined:
- Sentiment Analysis for Mental Health – social media posts labeled for sentiment.
- Suicide and Depression Text Classification – posts labeled for suicidal content.
- Twitter Sentiment Analysis about Depression – large-scale Twitter posts annotated for mental health indications.
- Emotion Detection and Mental Health Analysis – posts labeled for emotional states and mental health markers.
- Global Suicide Statistics – country-level suicide rates, age, gender, GDP, and HDI for longitudinal demographic analysis.
Comprehensive Mental Health Datasets (1–4): Include user identifiers, post text, timestamps, engagement metrics (likes, retweets, replies), and user metadata (followers, friends, gender, age, location where available). After rigorous preprocessing — text normalization, keyword extraction, deduplication, and removal of low-information entries — the pipeline produced 20,000 high-quality, curated data points.
World Suicide Statistics Dataset (5): Official country-level suicide statistics broken down by year, gender, age group, number of suicides, population, and suicide rate per 100,000 people — providing a factual baseline for global and regional trends.
By combining real-time, user-level social signals with official population-level outcomes, the study correlates online behavioral indicators with actual suicide trends across individual, group, and global levels.
3. Methodology
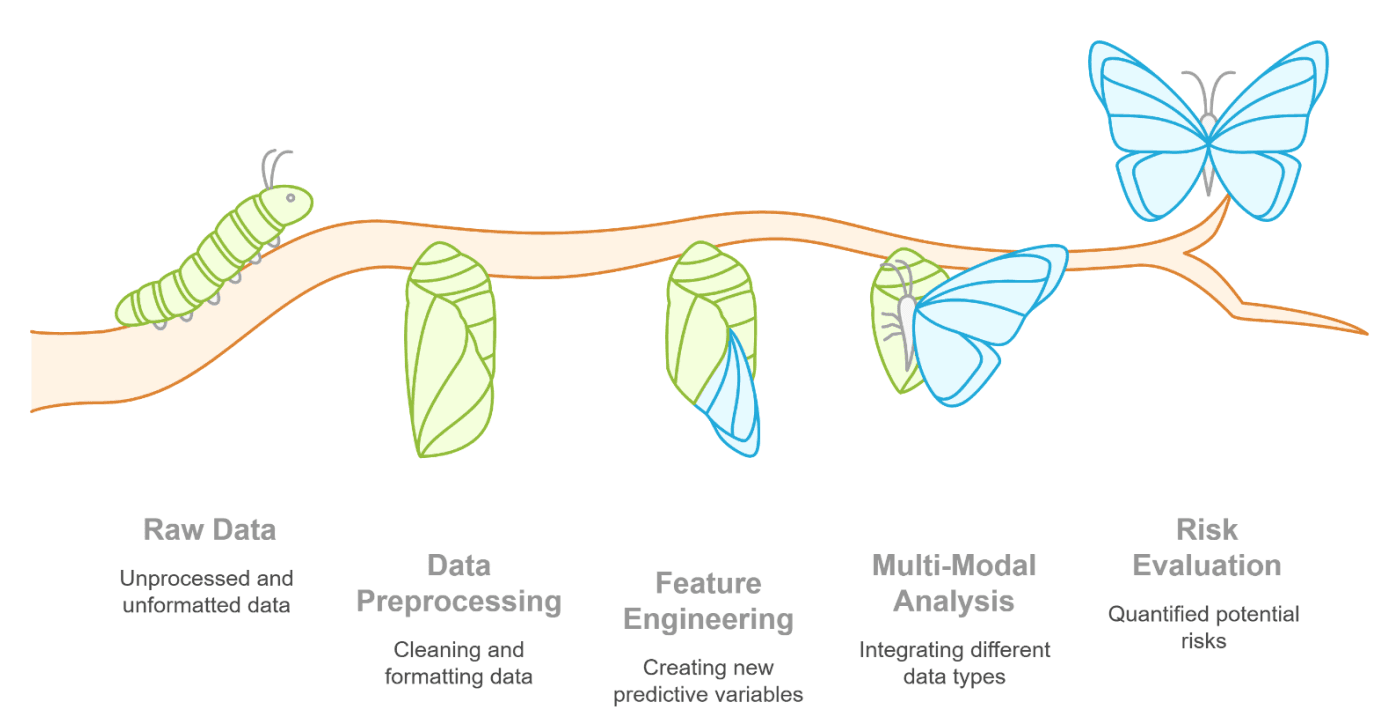
A. Data Preprocessing
Text normalization (lowercasing, removing URLs, special characters)
Combining post content, keywords, mental-state annotations, and suicide indicators
Extracting behavioral metrics: followers, friends, retweets, post frequency, post length
B. Feature Engineering
Linguistic features: high-risk keywords, emotion lexicons, sentiment scores
Behavioral features: posting frequency, engagement, temporal activity
Demographic inference: age group, gender, generation, and probable country via global statistics
C. Multi-Modal Analysis
Text analysis: word clouds, n-gram frequency, sentiment-emotion correlation
Behavioral analysis: scatter plots of risk vs. followers, engagement, posting frequency
Demographic analysis: age and gender risk trends, generational mapping
Geospatial analysis: probabilistic country assignment for top-risk users, interactive choropleth maps
D. Risk Evaluation
A composite user risk score (0–100) was computed using:
High-risk keyword density
Frequency of suicidal posts
Behavioral metrics (post frequency, engagement, follower count)
Limitations of Traditional Approaches
Mental health risk analysis on social media has traditionally relied on manual review and basic automated tools:
Security risks: handling sensitive user data manually increases exposure to breaches
Performance bottlenecks: single-dimensional analysis can't efficiently process large-scale data
Cost: manual reviews require substantial human resources
Complexity: integrating multiple behavioral, textual, and demographic dimensions is labor-intensive and error-prone, often leading to false positives or missed cases
Enter Terno AI
Terno AI is an agentic AI-driven platform designed to improve mental health risk detection and monitoring.
Overview: A multi-modal platform that automatically analyzes behavioral, textual, and social network data to identify at-risk individuals.
Key capabilities used: Desktop, SaaS, and AMI modules for scalable deployment, real-time processing, and cross-platform integration.
Core idea: Combine posting frequency, post length, engagement metrics, social connections, and textual signals — with demographic and historical data — to accurately identify genuine mental health risk cases.
By integrating these features, Terno AI reduces false positives, accelerates analysis, ensures data security, and provides scalable, cost-effective, precise mental health monitoring.
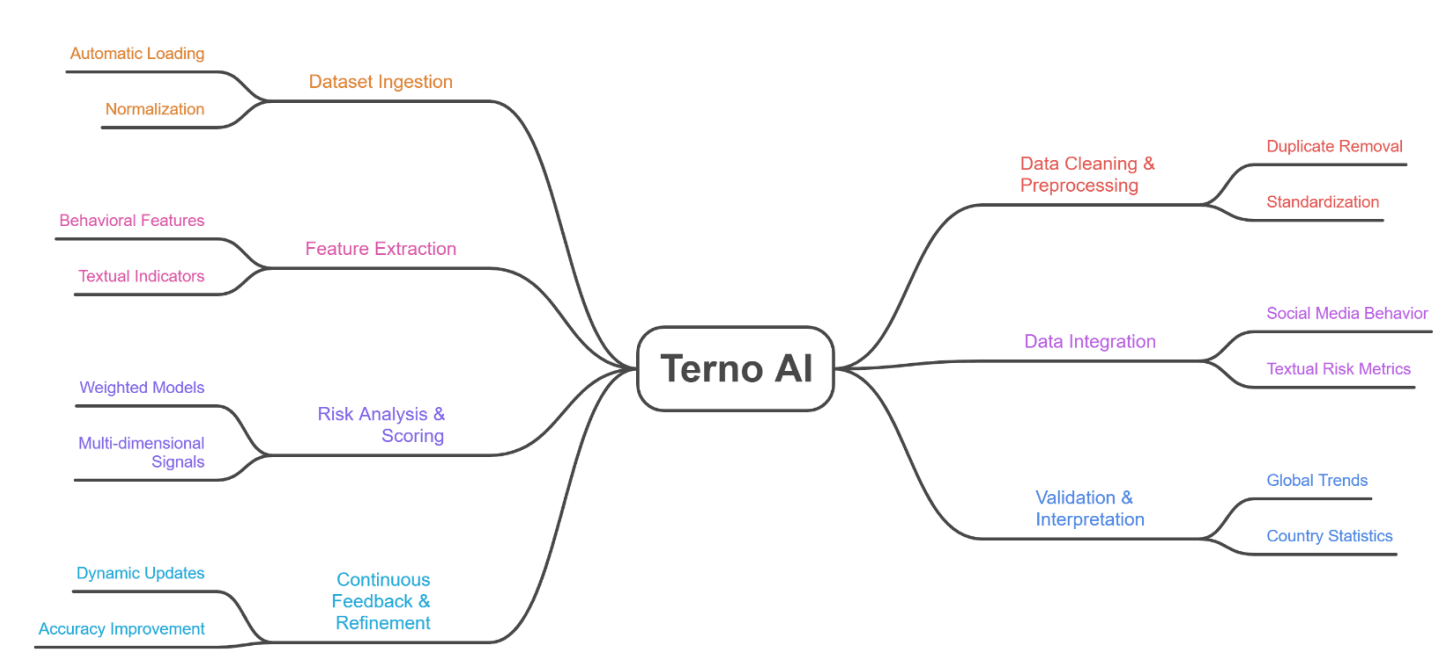
TernoAI executes the complete pipeline — data ingestion, preprocessing, feature extraction, multi-dimensional integration, and risk analysis — in a fully automated, scalable manner, delivering higher efficiency, improved accuracy, and faster insights than manual Python-based analytics.
4. Results and Evaluation
4.1 Pattern Recognition from Social Media Posts
Pattern recognition means identifying recurring signals in language and behavior — specific keywords ("hopeless," "tired," "alone," "die," "suicide"), posting frequency (sudden spikes or withdrawal), and engagement patterns (low interaction or unusually high emotional responses). Combined, these signals help detect early signs of depression or anxiety and estimate suicidal-tendency risk.
A baseline Python pipeline was built as a quality-control benchmark against TernoAI. The baseline successfully identified frequently occurring distress-related keywords and general behavioral trends, but its frequency-based keyword extraction lacked contextual understanding — it flagged negative emotional states without consistently capturing specific mental health conditions or suicidal intent.
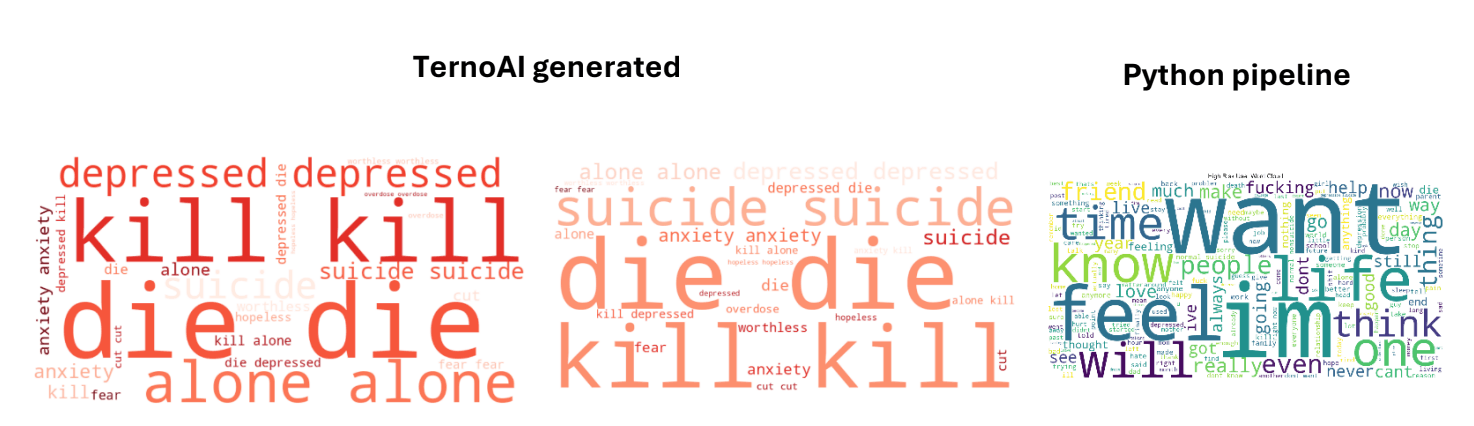
TernoAI demonstrated superior, context-aware pattern recognition, identifying more precise linguistic signals directly tied to suicidal ideation and progression toward self-harm — and did so with multiple concurrent predictions, unlike the Python pipeline.
4.2 Posting Time and Frequency vs. Risk
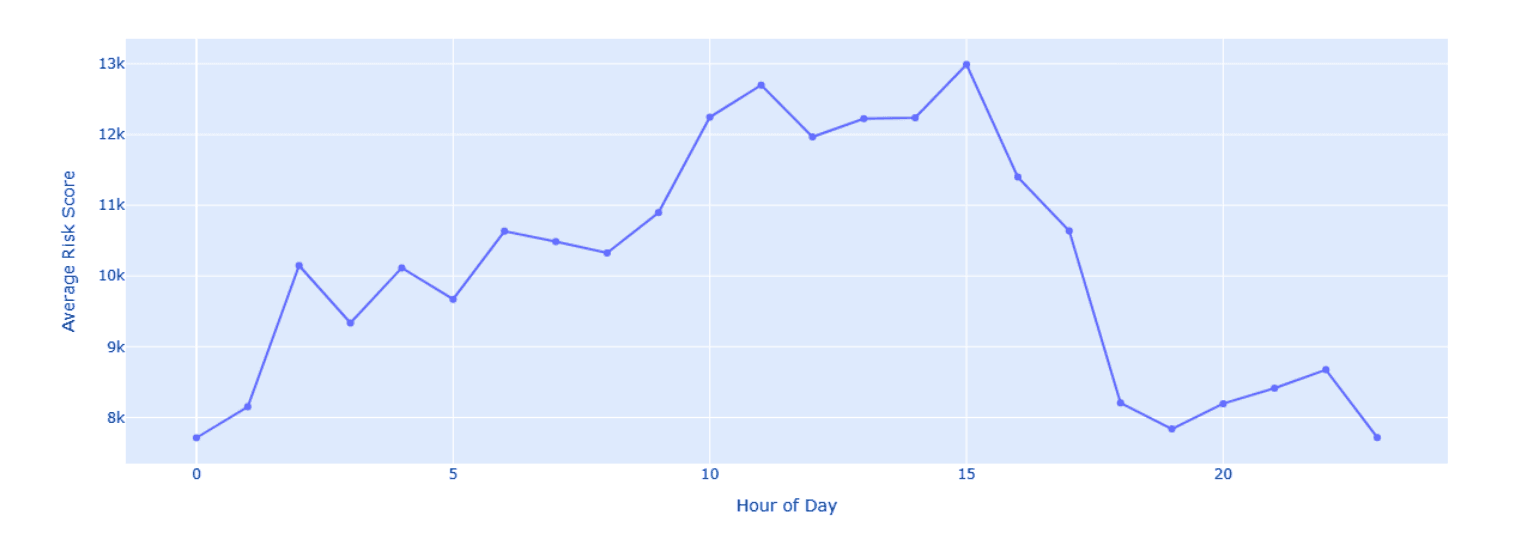
Risk peaks during evening and late-night hours (18:00–23:00), with the highest values around 18:00–20:00 (≈0.70). The lowest risk levels occur during morning hours (06:00–10:00, ≈0.28–0.32), with a steady upward trend from afternoon into night.
This suggests mental health vulnerability rises at night — potentially due to reduced social interaction, isolation, cognitive fatigue, rumination, and circadian disruption.
But time-of-day alone isn't enough. The study also examined posting frequency:
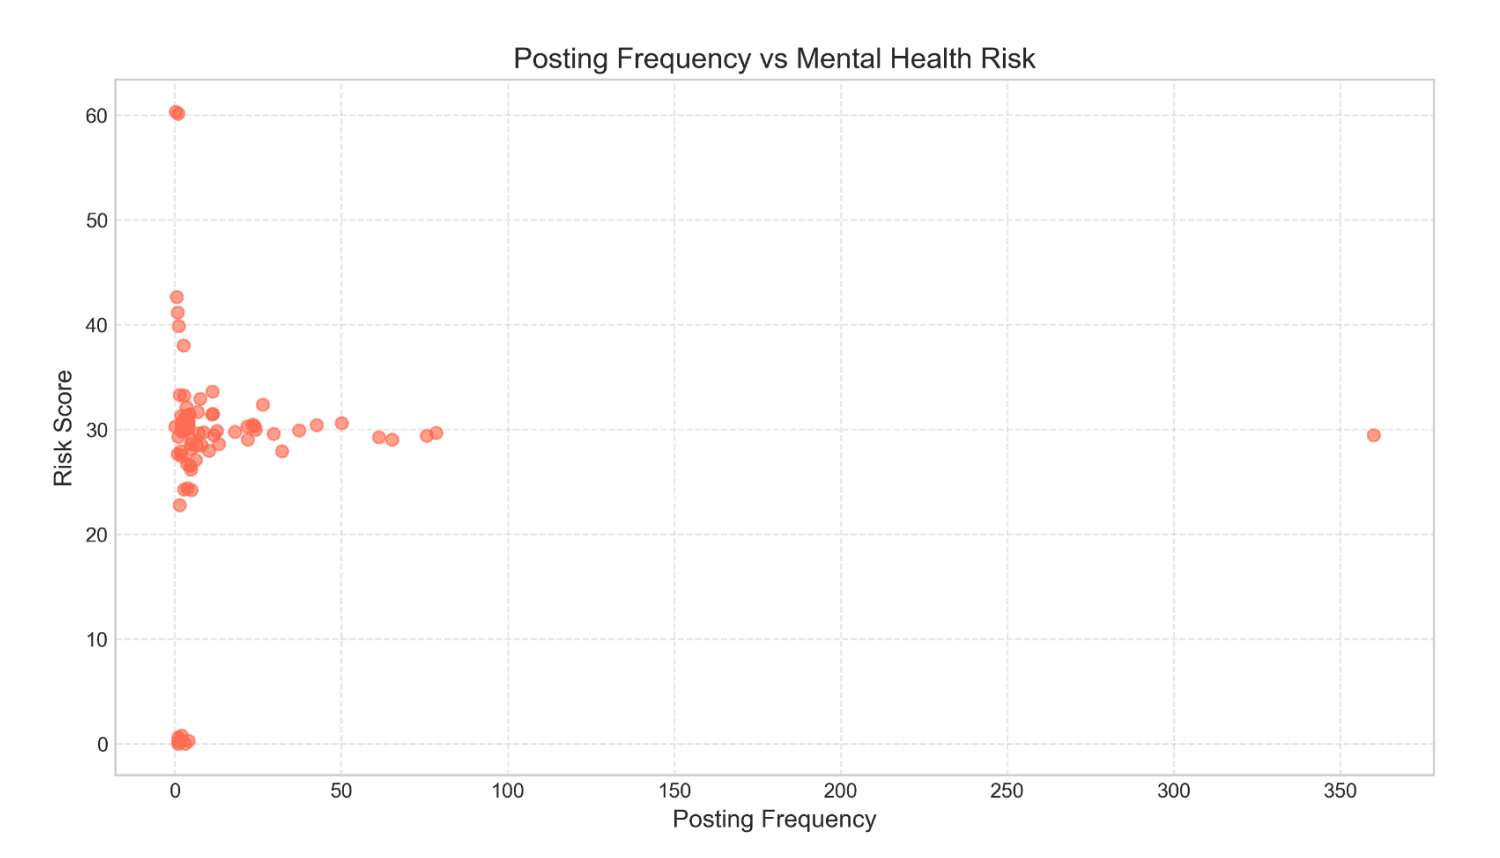
Most users cluster at low posting frequency (0–30 posts) with moderate risk scores (≈22–43). A single extreme outlier posted 350+ times with only a moderate risk score (~30) — showing that sheer activity volume alone isn't a reliable risk indicator.
Key takeaway: "When" a user posts matters more than "how often" they post. High-risk individuals aren't necessarily more frequent posters, but they're more likely to express distress during vulnerable evening/night windows. Risk detection should prioritize temporal and linguistic context over raw activity metrics.
4.3 Post Length and Social Engagement
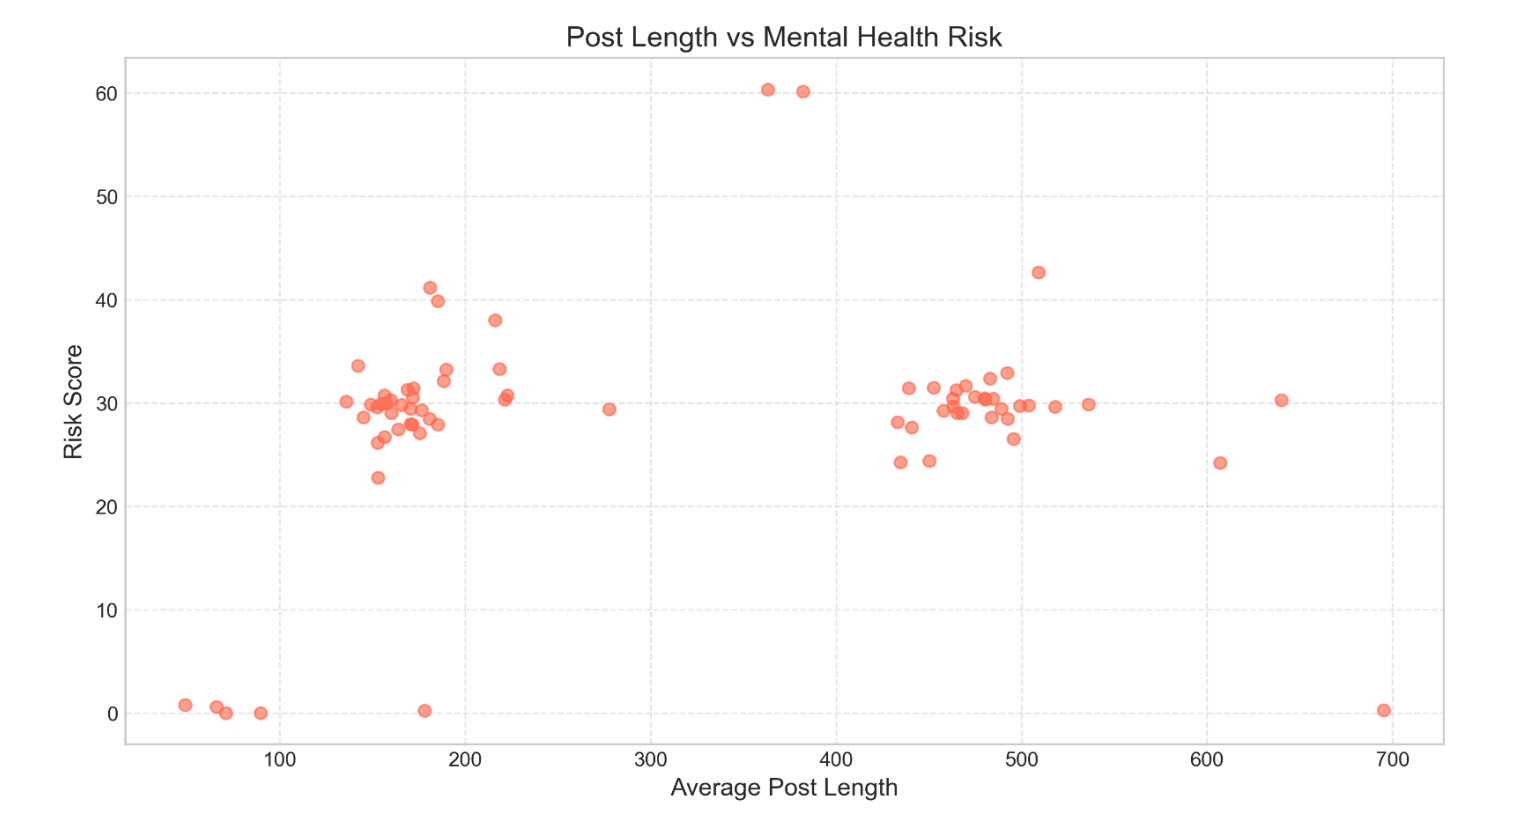
Two clusters emerged: a dense cluster at 100–220 words and a secondary cluster at 450–520 words — both in the same risk range (20–40). This suggests moderate-length and very long posts reflect similar levels of distress, just different modes of emotional expression.
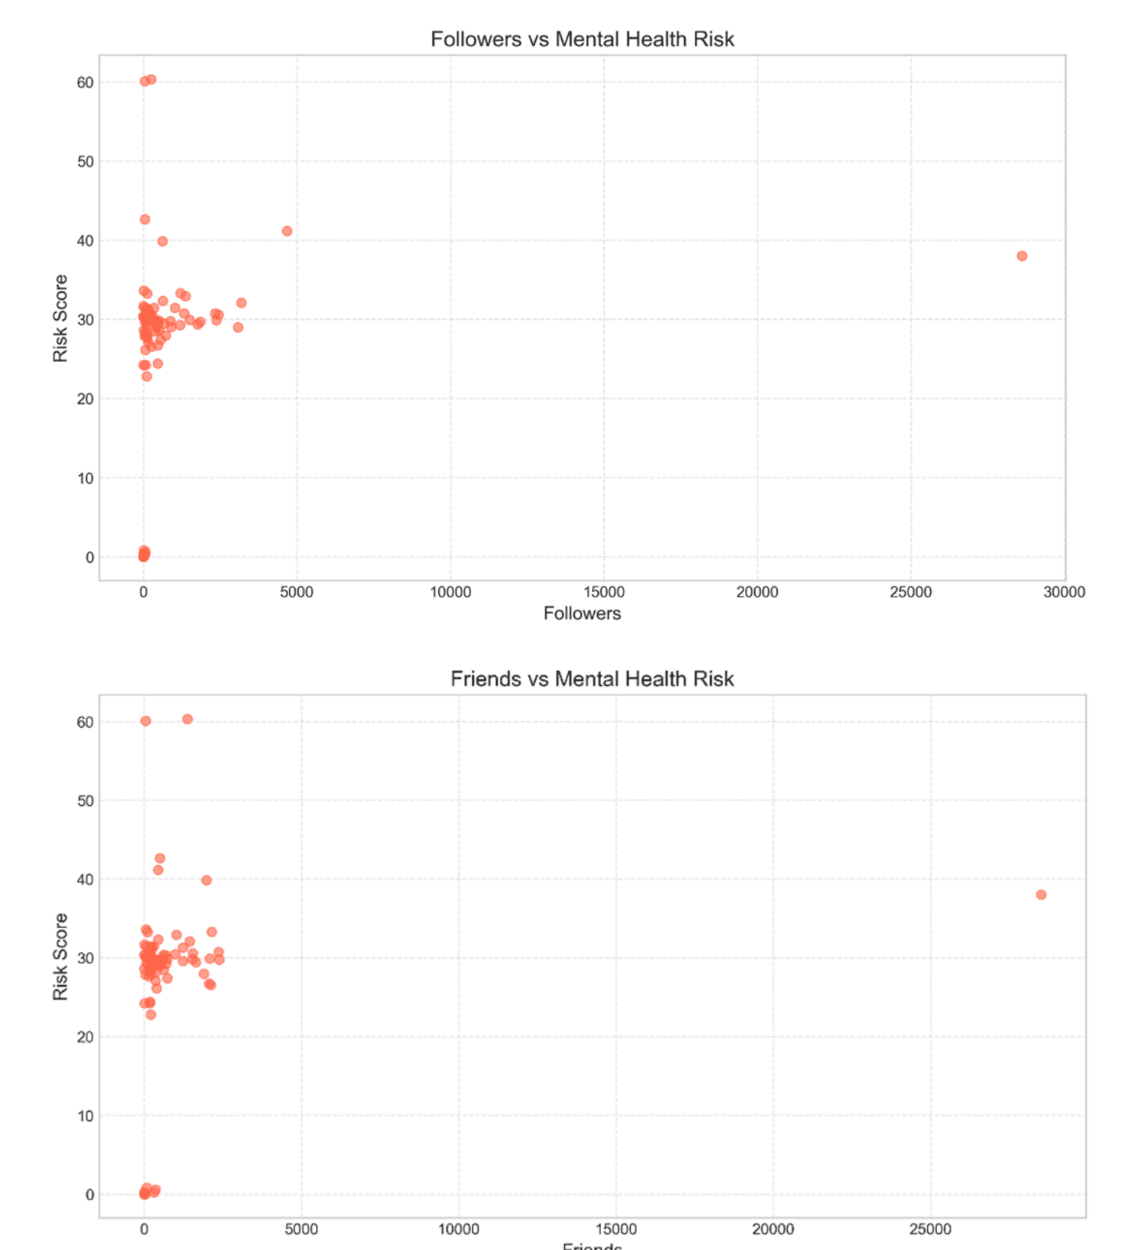
Most users have fewer than 5,000 followers/friends, with risk scores concentrated in the 20–40 range. Typical online connectivity levels neither significantly amplify nor reduce observed risk — meaning post length and engagement alone are weak standalone predictors of severity.
4.4 Correlation Matrix — Connecting the Dots
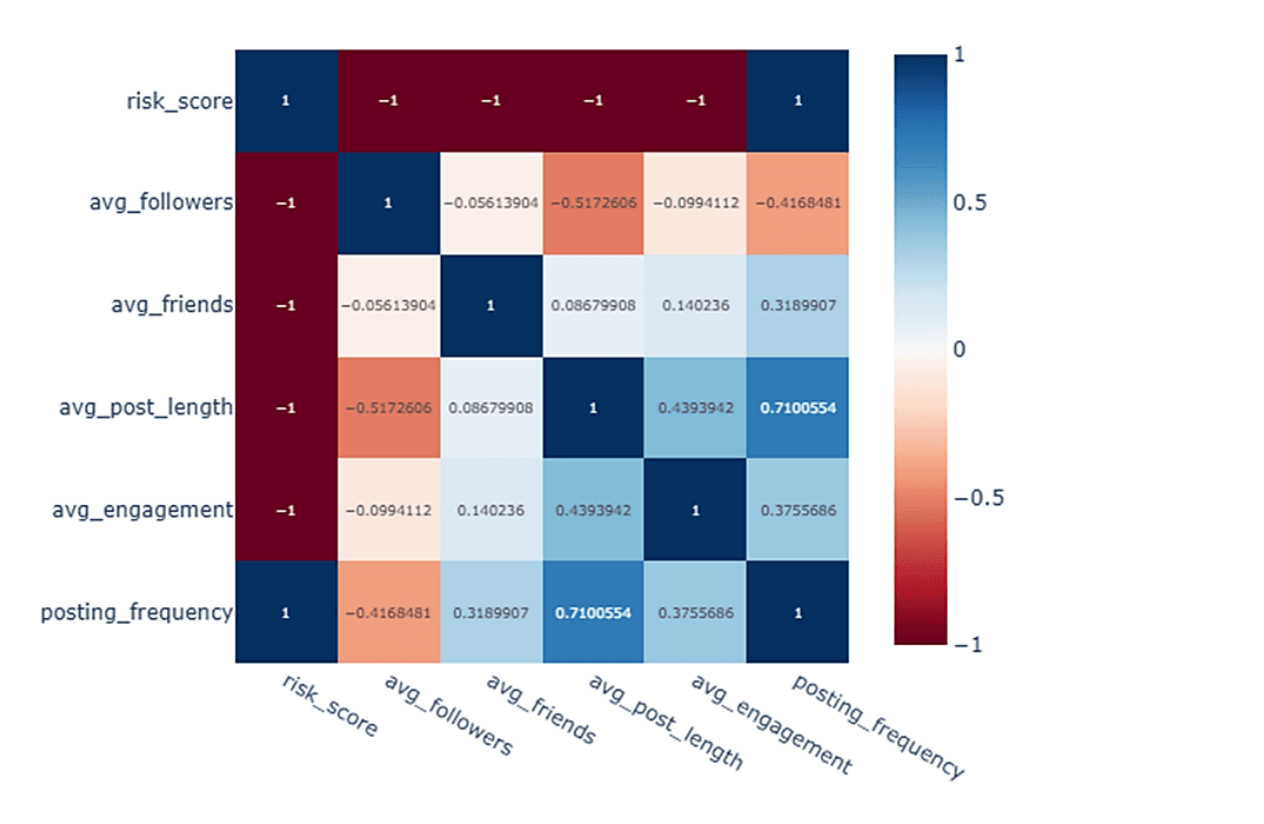
This is one of the most important findings of the study. The risk score shows:
Strong negative correlation (-1) with avg. followers, avg. friends, avg. post length, and avg. engagement
Strong positive correlation (+1) with posting frequency
In plain terms: individuals with higher mental health risk tend to post more frequently, but have fewer followers/friends, write shorter, less expressive posts, and get lower engagement — a pattern consistent with social withdrawal, reduced support networks, and unmet need for support, despite increased activity.
Other notable relationships:
Posting frequency correlates strongly with post length (0.71) — frequent posters tend to write longer content, possibly repetitive expressions of distress.
Post length moderately correlates with engagement (0.44).
Followers negatively correlate with post length (-0.52) — larger audiences tend to get shorter, more casual/broadcast-style posts.
Friends show weak-to-moderate positive correlation with engagement (0.14) and posting frequency (0.32).
Bottom line: behavioral intensity (how often people post) combined with social response (engagement and network size) is a critical, non-obvious indicator of mental health risk — one that can flag vulnerable individuals even without explicit high-risk language.
5. Global Suicide Statistics: The Bigger Picture
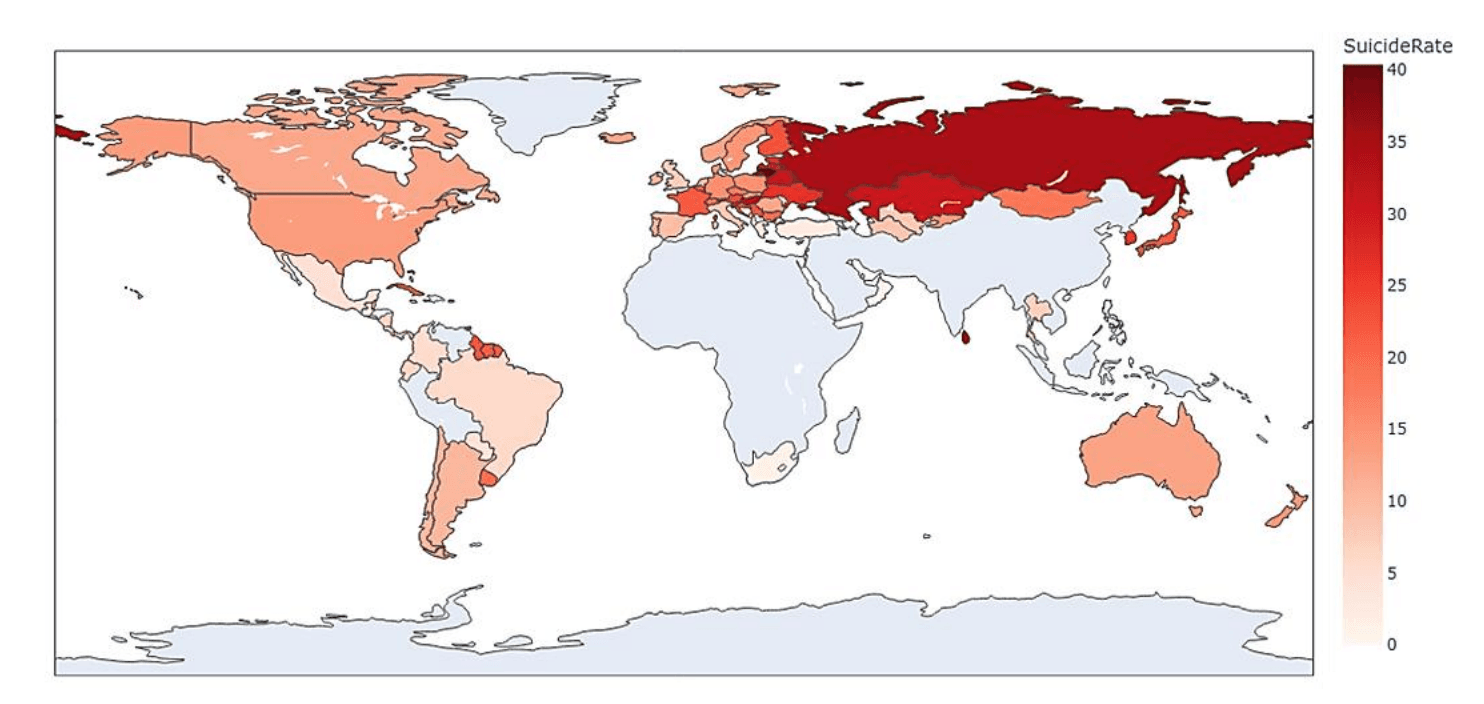
The study incorporated a global suicide dataset of 20,000+ curated data points spanning 15+ countries from 1985 to 2016, across age groups from 5 to 75+ years, with balanced male/female representation.
Key Observations
Geographic variation: The highest average suicide rates were found in:
Lithuania (~40.4/100k)
Sri Lanka (~35.3/100k)
Russian Federation (~34.9/100k)
Hungary (~32.8/100k)
Belarus (~31.1/100k)
Temporal trends: The global average has been relatively stable, but periods like 1990–1995 show notable peaks — possibly linked to geopolitical changes, economic crises, or societal stressors.
Socioeconomic parameters: GDP and HDI data were incomplete (HDI available for only ~30% of entries), but preliminary inspection suggests higher GDP per capita does not uniformly predict lower suicide rates — underscoring that suicide risk is multifactorial, shaped by mental health, culture, and social support structures, not just economic wealth.
Age and Gender Patterns
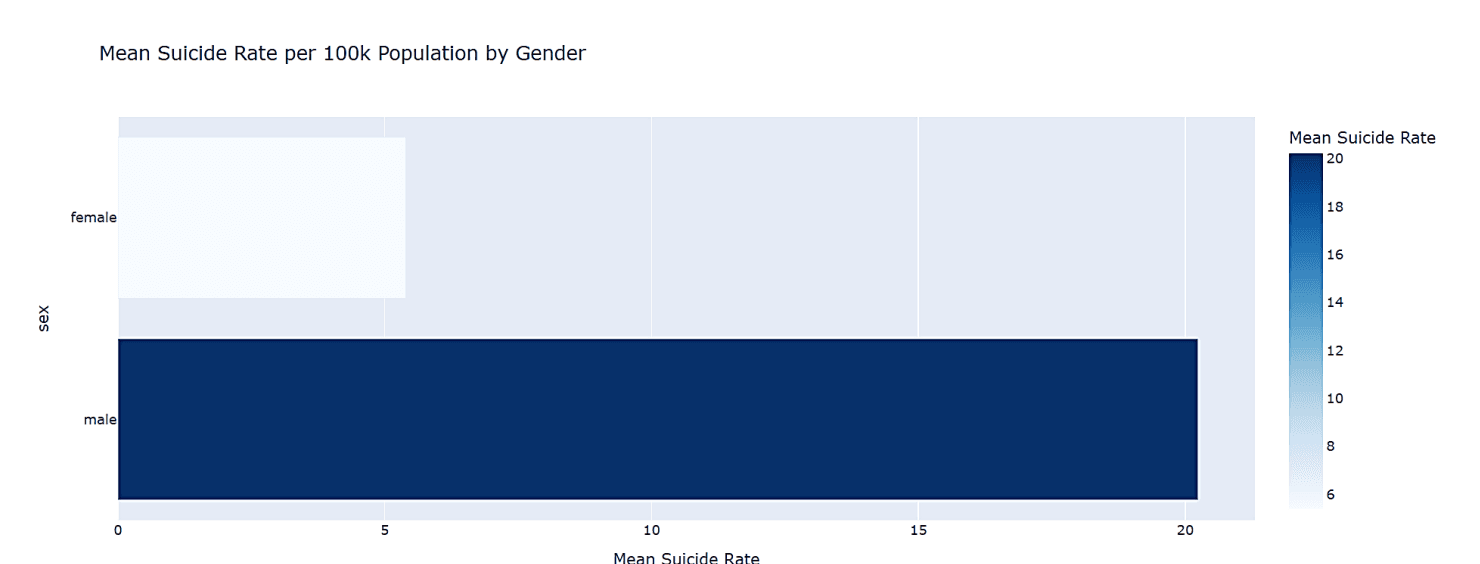
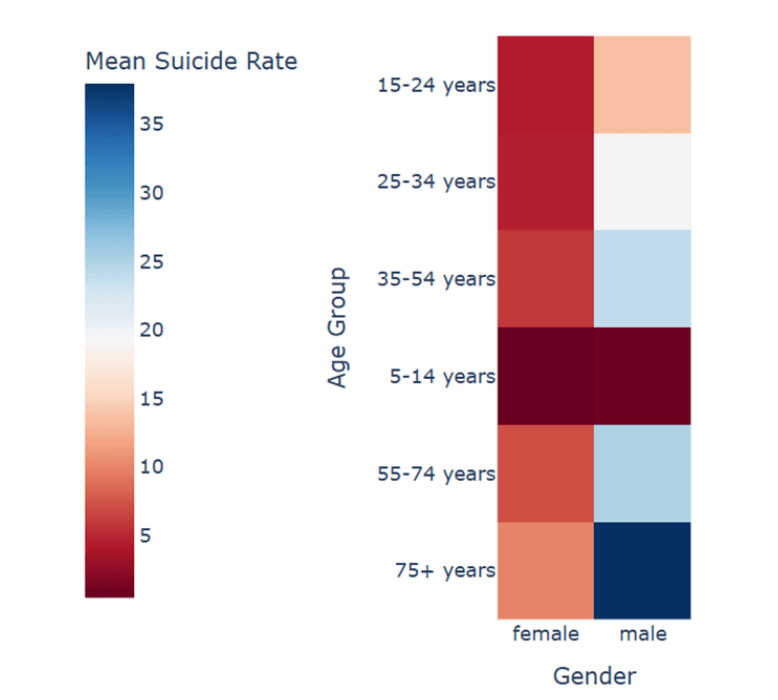
Gender disparity: Across all years, males show suicide rates nearly three times higher than females (e.g., 1985: males 17.9 vs. females 5.8 per 100k) — consistent with global epidemiological findings around coping strategies, stigma, and choice of more lethal methods.
Age variation:
- Lowest among children (5–14 years: ~0.5/100k)
- Moderate among young adults (15–34 years: ~8–10/100k)
- Peaks among middle-aged and older adults (55–74 years: ~15/100k; 75+ years: ~21–25/100k)
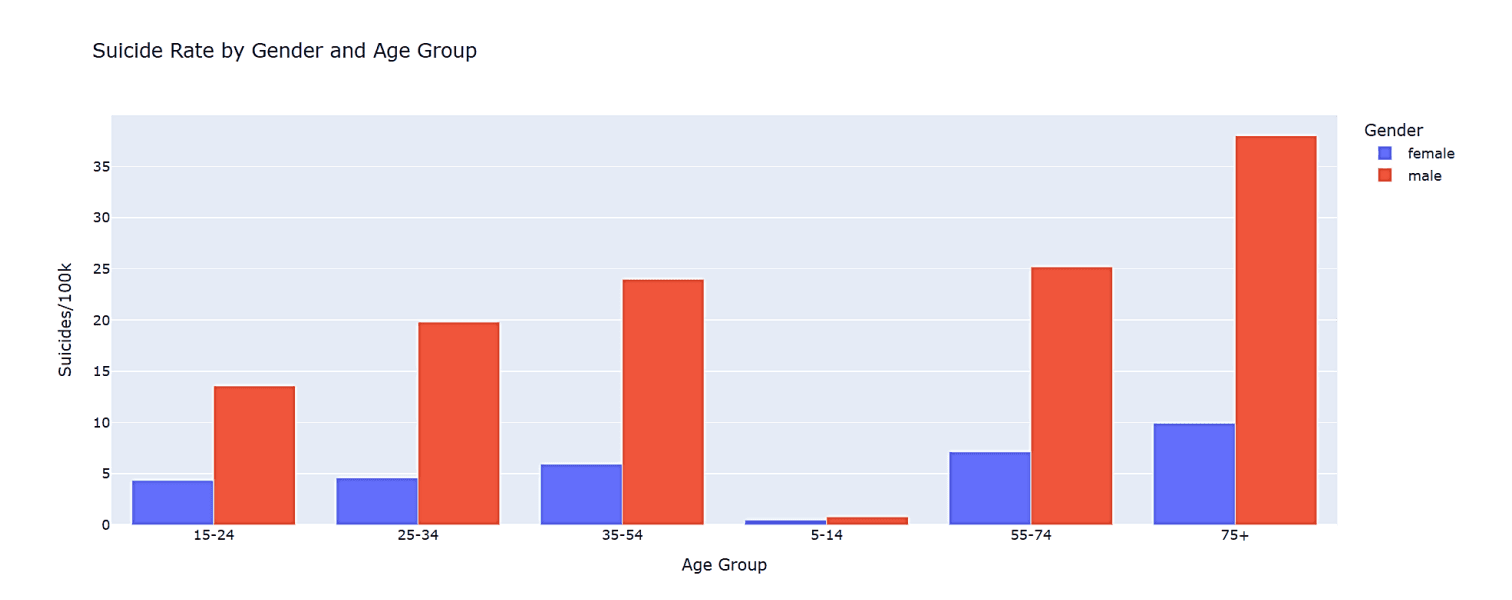
Older males (55+) represent the highest-risk demographic globally, consistent across most countries. Female suicide rates, while lower, also gradually increase with age — pointing to a need for tailored interventions for older women too.
These patterns point to biopsychosocial risk factors: gender-based social expectations, economic pressures, social isolation in older age, and access to lethal means. Temporal peaks in male suicides may also correlate with economic or political crises.
6. Practical Application: Telling Real Risk from Noise
A central challenge: how do you tell a genuine mental health risk expression from an exaggerated, situational, or non-representative one?
Here, "genuine" doesn't mean judging a person's intent — it means identifying consistent, multi-pattern behavioral signals that align with established indicators of risk over time, rather than relying on a single post or keyword.
Stage 1: Text-Only Signals Can Mislead
Looking only at high-risk keyword counts and suicidal-post ratios initially flagged certain users as extremely critical — purely based on linguistic intensity and volume.
Table 1: User-level post statistics and preliminary mental health risk scores
| user_id | total_high_risk_words | total_posts | suicidal_posts | suicidal_post_ratio | risk_score |
|---|---|---|---|---|---|
| 490044008 | 6243 | 2117 | 1036 | 0.48937175 | 16603 |
| 3249600438 | 4649 | 1504 | 759 | 0.50465426 | 12239 |
| 1458225506 | 4524 | 1593 | 769 | 0.48273697 | 12214 |
| 145626605 | 3908 | 1276 | 640 | 0.5015674 | 10308 |
| 1497350173 | 2390 | 792 | 423 | 0.53409091 | 6620 |
| 1052121847 | 2122 | 717 | 359 | 0.50069735 | 5712 |
| 20118423 | 2116 | 698 | 351 | 0.50286533 | 5626 |
| 1616997456 | 672 | 888 | 433 | 0.48761261 | 5002 |
| 3346224328 | 1621 | 650 | 322 | 0.49538462 | 4841 |
| 18831261 | 1658 | 543 | 267 | 0.49171271 | 4328 |
From this table, users 490044008, 3249600438, and 1458225506 appeared to be the most critical cases due to extremely high counts of risk-related keywords, a large number of total posts, and high suicidal-post ratios (~0.48–0.50). At this stage, these users were flagged as the most vulnerable purely based on linguistic intensity and volume of distress signals.
Stage 2: Behavioral and Engagement Metrics Change the Picture
When behavioral data — average followers/friends, post length, engagement, posting frequency, and days active — was added, the interpretation evolved.
Table 2: User engagement, posting behavior, and temporal activity metrics
| user_id | avg_followers | avg_friends | avg_post_length | avg_engagement | time_of_first_post | time_of_last_post | post_count | days_active | posting_frequency |
|---|---|---|---|---|---|---|---|---|---|
| 14724376 | 350 | 207 | 455.0147 | 8666.102639 | 2016-02-20 23:19:00+00:00 | 2016-03-21 22:18:15+00:00 | 341 | 30 | 11.3666667 |
| 18831261 | 884 | 2389 | 506.639 | 9050.655617 | 2016-12-13 20:20:18+00:00 | 2017-01-12 08:13:42+00:00 | 543 | 30 | 18.1 |
| 20118423 | 288 | 988 | 482.4341 | 283.0386819 | 2015-11-25 18:40:49+00:00 | 2015-12-25 00:36:22+00:00 | 698 | 30 | 23.2666667 |
| 20863408 | 104 | 247 | 136.9145 | 2924.222222 | 2015-04-01 23:44:35+00:00 | 2015-05-01 23:44:25+00:00 | 117 | 30 | 3.9 |
| 26620439 | 4679 | 439 | 182.16 | 3786.56 | 2015-01-31 21:22:24+00:00 | 2015-03-02 02:15:49+00:00 | 25 | 30 | 0.8333333 |
| 28727726 | 629 | 1975 | 186.3143 | 365 | 2015-09-17 03:48:57+00:00 | 2015-10-16 22:24:10+00:00 | 35 | 30 | 1.1666667 |
| 29053403 | 465 | 189 | 452.6339 | 584.2589286 | 2016-12-14 04:44:41+00:00 | 2017-01-12 08:13:50+00:00 | 112 | 30 | 3.7333333 |
| 30863895 | 426 | 482 | 468.0775 | 2601.992958 | 2014-12-22 12:20:34+00:00 | 2015-01-19 00:09:30+00:00 | 142 | 28 | 5.0714286 |
| 38988469 | 2338 | 175 | 157.5352 | 343.0985915 | 2015-01-25 22:00:00+00:00 | 2015-02-24 19:00:02+00:00 | 71 | 30 | 2.3666667 |
| 39248633 | 2454 | 1547 | 173.0168 | 57.09243697 | 2015-09-07 16:15:41+00:00 | 2015-10-07 13:15:50+00:00 | 119 | 30 | 3.9666667 |
It was observed that:
Some users with high keyword frequency did not exhibit high posting frequency or consistent behavioral intensity.
Others showed low engagement despite high activity, indicating possible isolation.
Users like 20118423 emerged as more behaviorally significant due to very high posting frequency (
23 posts/day) and long expressive posts (482 words).
Lesson: frequency and consistency of expression are critical for telling whether distress signals are persistent (genuine concern) or episodic (situational).
Stage 3: Demographic and Global Mapping Refines It Further
Finally, mapping users to countries and age groups with known suicide-rate patterns sharpened prioritization.
Table 3: Normalized mental risk scores with predicted country and age group
| user_id | normalized_mental_risk_score | predicted_country_of_origin | predicted_closest_age_group |
|---|---|---|---|
| 490044008 | 1 | Lithuania | 75+ years |
| 3249600438 | 0.644480652 | Ukraine | 55-74 years |
| 1458225506 | 0.642443992 | Ukraine | 55-74 years |
| 145626605 | 0.487169043 | Bulgaria | 25-34 years |
| 1497350173 | 0.186720978 | United Kingdom | 15-24 years |
| 1052121847 | 0.112749491 | Bosnia and Herzegovina | 5-14 years |
| 20118423 | 0.105743381 | Georgia | 5-14 years |
| 1616997456 | 0.05490835 | Grenada | 5-14 years |
| 3346224328 | 0.041792261 | Qatar | 5-14 years |
| 18831261 | 0 | Dominica | 5-14 years |
At this stage:
Some initially high-risk users aligned with high-risk demographics — e.g., user 490044008 mapped to Lithuania (75+ years), and users 3249600438 / 1458225506 mapped to Ukraine (55–74 years) — reinforcing their priority as genuinely high-risk.
Others were mapped to lower-risk age groups (e.g., 5–14 years) or lower-risk regions — reducing their relative priority.
Why the Prioritization Changed
The shift occurred because of four added validating dimensions:
- Behavioral consistency (posting frequency, duration of activity)
- Depth of expression (post length, repeated narratives)
- Social context (followers, friends, engagement)
- Demographic alignment (age group, country-level suicide statistics)
This multi-layer validation separates:
Sustained, behaviorally reinforced distress signals → more likely genuine risk
Isolated or context-driven signals → lower confidence in classification
The Most Credible High-Risk Profile
After combining all three data layers, the most credible high-risk users consistently show:
High risk-keyword density and high suicidal-post ratio
High posting frequency over sustained periods
Moderate-to-low engagement despite high activity (possible social disconnect)
Alignment with high-risk age groups (55+ and 75+)
Association with countries with historically higher suicide rates (e.g., Lithuania, Ukraine, Eastern Europe)
The core insight: true mental health risk cannot be reliably identified using a single dimension. Textual analysis is a useful starting point, but behavioral and demographic context fundamentally refines and improves detection accuracy — enabling a more precise, evidence-backed way to prioritize who may genuinely need help.
7. Discussion and Conclusion
This study presents a comprehensive, multi-dimensional analysis of mental health risk and suicidal tendencies by integrating social media behavior, textual content, and global suicide statistics. Behavioral signals — posting frequency, post length, and engagement — when combined with demographic information and textual indicators, provide a reliable framework for identifying genuinely high-risk individuals, while filtering out attention-seeking or publicity-driven posts.
Globally, suicide rates remain highest among older males and vary significantly by country, with Lithuania, Sri Lanka, Russia, Hungary, and Belarus showing elevated rates. Age, gender, and geographic trends all point to the need for tailored intervention strategies. Temporal posting patterns also show real promise as an early-warning mechanism for preventive action.
Social Impact
Clinical relevance: Early detection through behavioral and textual signals can inform clinicians and mental health professionals, enabling timely intervention before crises escalate.
Public health insights: Demographic and geographic trends can guide public health authorities in designing targeted suicide-prevention programs and allocating resources efficiently.
Data science contribution: This work demonstrates the effectiveness of multi-modal, multi-dataset integration for a nuanced understanding of mental health risk.
Technology evaluation: AI-driven agentic platforms like TernoAI proved effective at handling large-scale, heterogeneous datasets — improving both analytical efficiency and the quality of actionable insights.
In summary, a holistic approach — leveraging social media signals, user behavior, and global epidemiological data — can significantly enhance mental health risk assessment, laying a foundation for predictive, AI-assisted monitoring systems that support both clinical practice and public health interventions.
8. Future Directions
The study points to ten promising directions for future work:
- Expanded multimodal data integration – incorporating images, video, emojis, and voice content alongside text.
- Cross-platform behavioral analytics – extending beyond Twitter to Reddit, Instagram, TikTok, and messaging apps.
- Real-time and adaptive monitoring systems – moving from retrospective analysis to proactive detection.
- Integration with clinical and public health data – validating risk scores against verified outcomes to reduce false positives.
- Privacy-preserving machine learning – using federated learning, homomorphic encryption, and differential privacy to protect user anonymity.
- Enhanced linguistic and semantic models – leveraging transformer-based contextual embeddings for subtler distress detection.
- Bias and fairness audits – rigorously checking for demographic and cultural bias in risk detection.
- Longitudinal trend analysis and cohort tracking – studying risk progression over months or years, not just snapshots.
- Interactive dashboards for stakeholders – making insights actionable for clinicians, public health officials, and caregivers.
- Policy and community integration – partnering with NGOs, schools, and mental health services to translate data into real-world support.
Closing Thoughts
This research demonstrates that mental health risk on social media is not something you can reliably detect from a single signal — a keyword, a follower count, or a posting streak in isolation. It's the combination of linguistic content, behavioral consistency, social context, and demographic alignment that produces a credible, evidence-backed picture of who may genuinely need support. Platforms like TernoAI show real promise in making this kind of multi-dimensional analysis faster, more accurate, and more scalable — with real potential for early detection and life-saving intervention.
Read the full white paper

18 August 2026
The Honest Number Was 83%: Leakage, Abstention, and a Complaint Router You Can Actually Deploy
The same complaint-routing model scores 96.3% or 83.2% depending on which three columns you leave in the training data. The high number is the intake form being read back to you. This is what the leakage audit found before a single model was trained, why 83.2% is the honest figure, and how the same model — given permission to say "I don't know" — becomes deployable at 90.7% accuracy on 79.5% of traffic.

29 July 2026
EdgeGuard: AI-Driven Predictive Maintenance for Power Transformers
Power transformers are among the most critical assets in electrical distribution infrastructure. Their unexpected failure can result in power outages, safety hazards, equipment damage, expensive repairs, and long service interruptions. Traditional transformer maintenance practices often rely on periodic manual inspection, offline testing, or run-to-failure maintenance. These methods are expensive, slow, labor-intensive, and unable to detect rapidly developing faults in real time. EdgeGuard is an AI-driven, edge-computing predictive maintenance system designed to continuously monitor transformer health and forecast failures before catastrophic damage occurs. The system acts as a retrofittable “Digital Doctor” for distribution transformers by combining low-cost industrial sensors, an ESP32 microcontroller, local intelligence, machine learning-based risk prediction, autonomous relay control, and a real-time web dashboard. The proposed system monitors six major transformer health indicators: temperature, humidity, vibration, oil level, current, and voltage. These signals are normalized and processed through a Multi-Layer Perceptron neural network to classify transformer condition and estimate failure risk. If the predicted risk crosses a critical threshold of 80%, EdgeGuard automatically triggers a relay through GPIO 26 to isolate the transformer from the electrical network. The system also supports secure remote control, dashboard monitoring, API-key-based hardware authentication, JWT-based user access, WebSocket live updates, and automatic live-hardware detection. With an estimated deployment cost of approximately ₹3,850, EdgeGuard offers a low-cost alternative to conventional transformer monitoring systems. Its cloud-independent operation and edge-based decision-making make it especially useful for rural and semi-urban distribution grids where connectivity and maintenance resources are limited.

28 July 2026
ANALYZING TOXIC USER BEHAVIOR AND RISK PATTERNS IN ONLINE GAMING PLATFORMS
This study shows that behavioral data alone can't reliably predict gaming toxicity — but a risk-based model combining behavioral and engineered features does a much better job of flagging the small segment of high-risk users driving disproportionate harm.