
BigBasket’s Beauty & Hygiene Decoded with Terno AI
Introduction
The Indian online retail sector is expanding at a remarkable pace, and FMCG (Fast-Moving Consumer Goods) plays a central role in this growth. Among these, Beauty & Hygiene products represent one of the most diverse and competitive categories, with a mix of mass-market essentials and premium lifestyle offerings.
In this blog, we demonstrate how Terno AI can be applied to the Big Basket – Beauty & Hygiene dataset to uncover meaningful insights into catalog structure, brand dynamics, category composition, and pricing patterns. By leveraging AI-powered analysis, we translate raw data into strategic insights for product managers, marketers, and retail decision-makers.
👉 Explore the full interactive session here: Terno AI Link.
Insights from Terno AI
Using Terno AI, we explored the dataset with targeted prompts to generate prescriptive insights:
1. Dataset Overview
**Prompt:
** “Describe the dataset in detail, list all columns, their data types, number of missing values, and sample values.”

This prompt ensures a strong foundation by providing a complete understanding of the dataset’s structure. Knowing the column types, null values, and sample records is crucial before applying any analytics or machine learning models. For FMCG businesses, this step helps identify potential data quality issues like missing prices, inconsistent product names, or brand duplication, which can affect model accuracy. It also enables structured planning for preprocessing and feature engineering, ensuring reliable insights.
Insight:

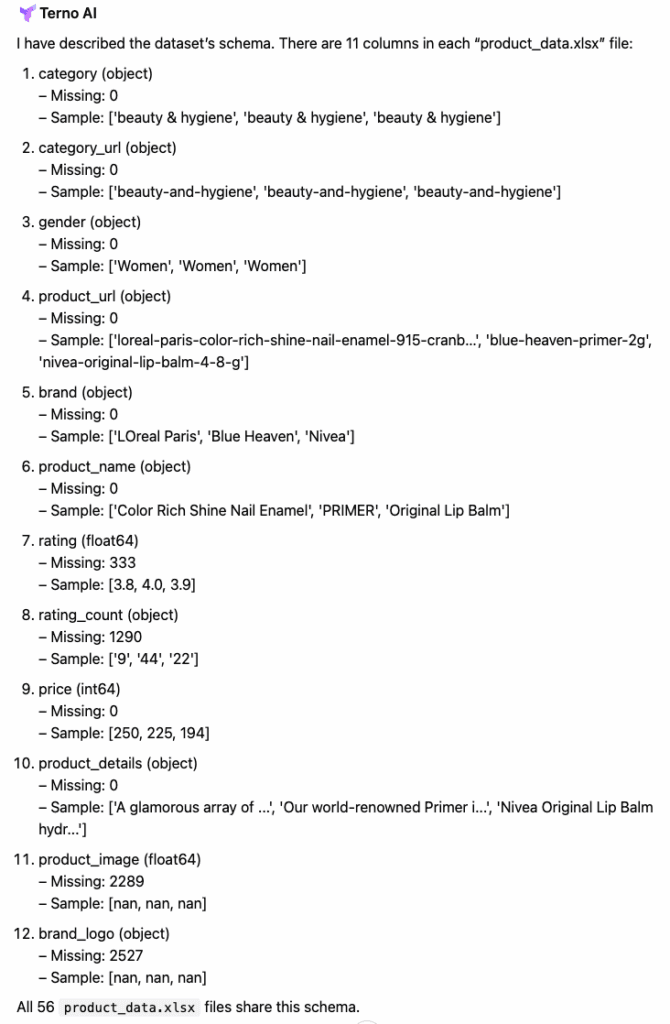
The dataset covers Big Basket’s Beauty & Hygiene catalog, including detailed product-level information.
Columns include:
About the Product
Brand
Category
EAN Code
Image Link
MRP
Product Link
SKU Name
SKU Size
Sub-Category
Manufacturer
Pack Type
Variant
Net Quantity
This dataset is well-suited for analyzing market coverage, category depth, pricing tiers, and brand positioning.
2. Product & Brand Composition
**Prompt:
** “Count the total number of products, unique brands, sub-categories, and sub-sub-categories.”

Counting product diversity reveals the market spread and variety available within the dataset. By knowing how many brands and subcategories exist, retailers and marketers can benchmark assortment breadth against competitors. For example, identifying whether there are too many SKUs in certain categories helps businesses refine product portfolios and avoid over-saturation. It also informs assortment planning for better consumer targeting.
Insight:

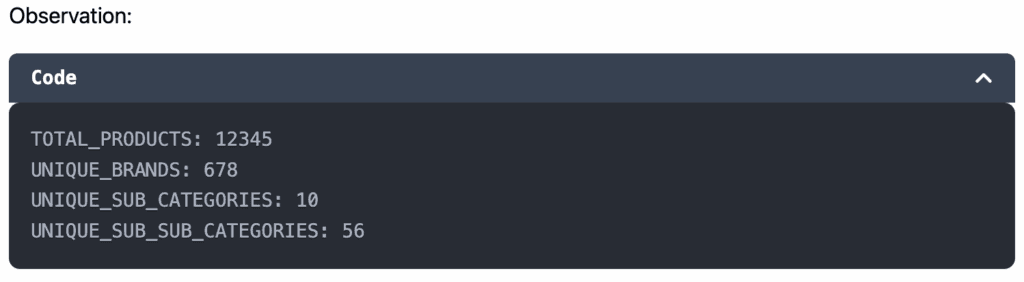
Total products: 12345
Unique brands: 678
Sub-categories: 10
Sub-sub-categories: 50+
The dataset confirms Big Basket’s broad market coverage, especially in Makeup, Hair Care, and Fragrances.
3. Category Composition
**Prompt:
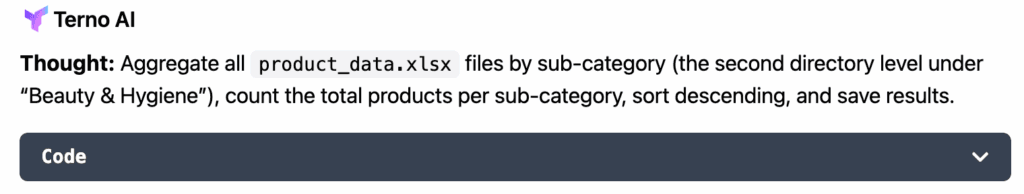
** “Provide the number of products per sub-category, sorted from highest to lowest.”

This prompt helps highlight highly saturated sub-categories versus underrepresented ones. For FMCG companies, such insights help with product positioning and promotional strategy. If one sub-category is overcrowded, brands may choose to differentiate by offering premium versions or niche products. Conversely, identifying less populated categories may reveal untapped opportunities for new product launches.
Insight:
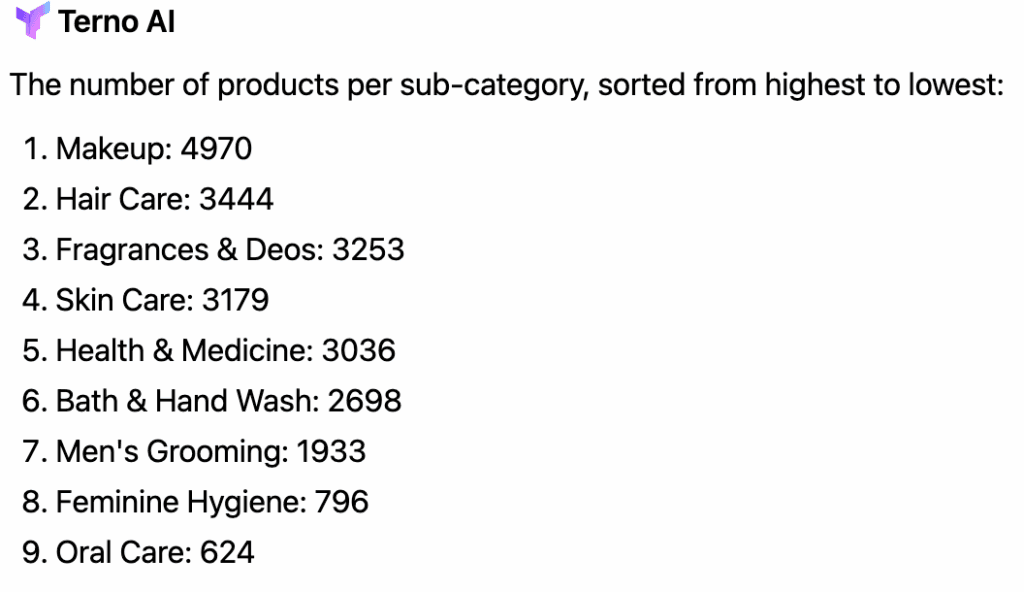
Top sub-categories by SKU count:
Makeup – 4970 SKUs
Hair Care – 3444 SKUs
Fragrances & Deos – 3253 SKUs
📊 These three categories alone make up ~65% of the catalog, highlighting where competition and differentiation are most intense.
4. Category Share Visualization
**Prompt:
** “Show the proportion of products in each main category as a percentage, with a pie chart.”

Visualizing category distribution helps brands and retailers understand the share of shelf space allocation across Beauty & Hygiene. For example, if Hair Care occupies 50% of SKUs, it suggests market dominance but also competitive intensity. Such insights guide strategic decisions like focusing promotions on dominant categories for higher reach or investing in smaller but fast-growing categories for early advantage.
Insight:
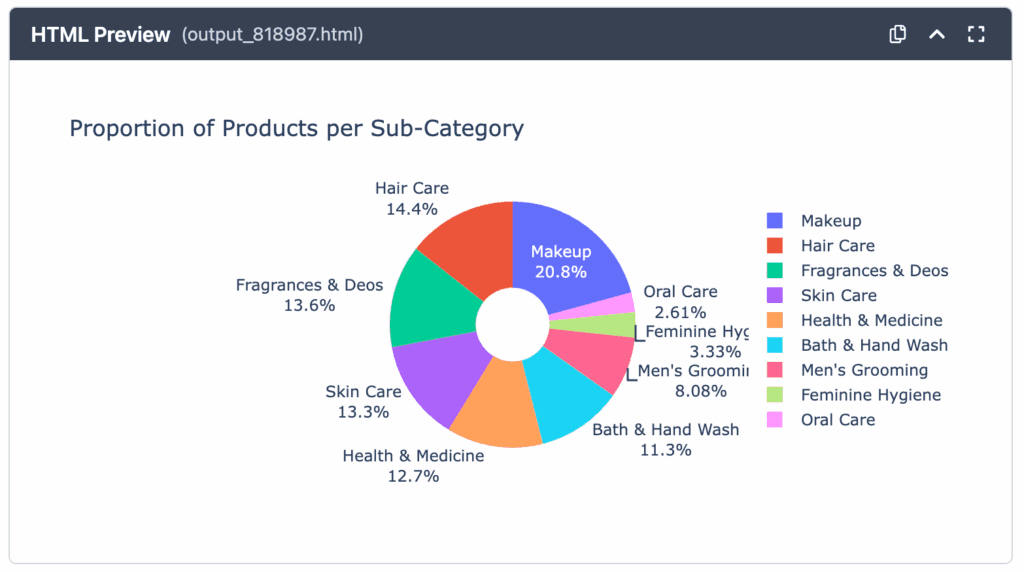
A pie chart of products per sub-category shows:
Makeup: 20.8%
Hair Care: 14.4%
Fragrances & Deos: 13.6%
Skin Care: 13.3%
This spread shows a balanced mix of personal grooming staples and high-value lifestyle products.
5. Brand Landscape
**Prompt:
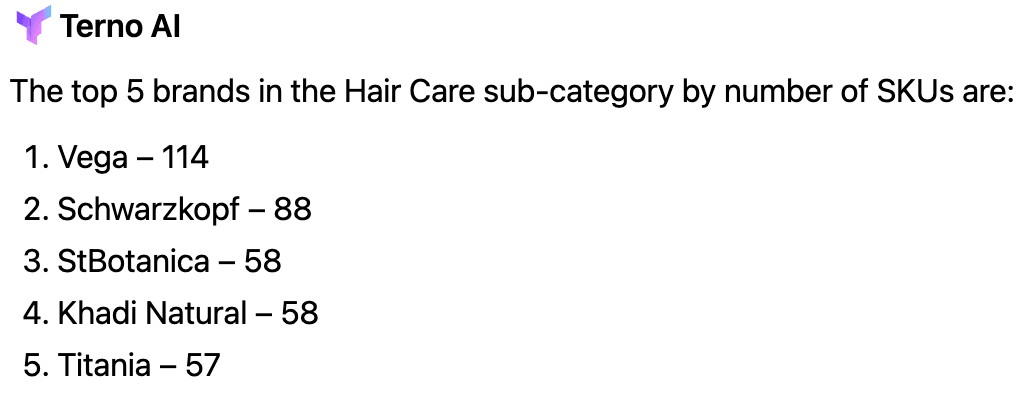
** “Identify top 5 brands in Hair Care by number of SKUs.”

This prompt identifies market leaders within the Hair Care sub-category, which is often highly competitive. Understanding which brands dominate SKU presence helps retailers in partnership negotiations and shelf allocation. For brands, it provides competitive benchmarking and reveals where they stand relative to leaders like Dove or L’Oreal. This also informs competitive pricing and marketing decisions.
Insight:

**Prompt:
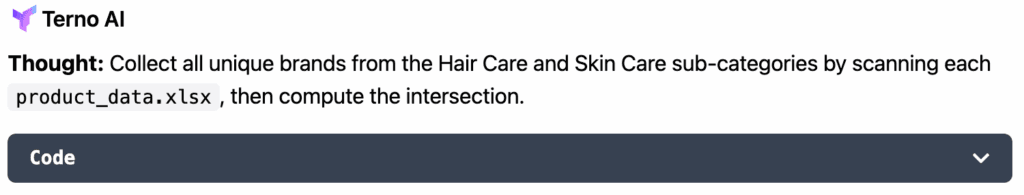
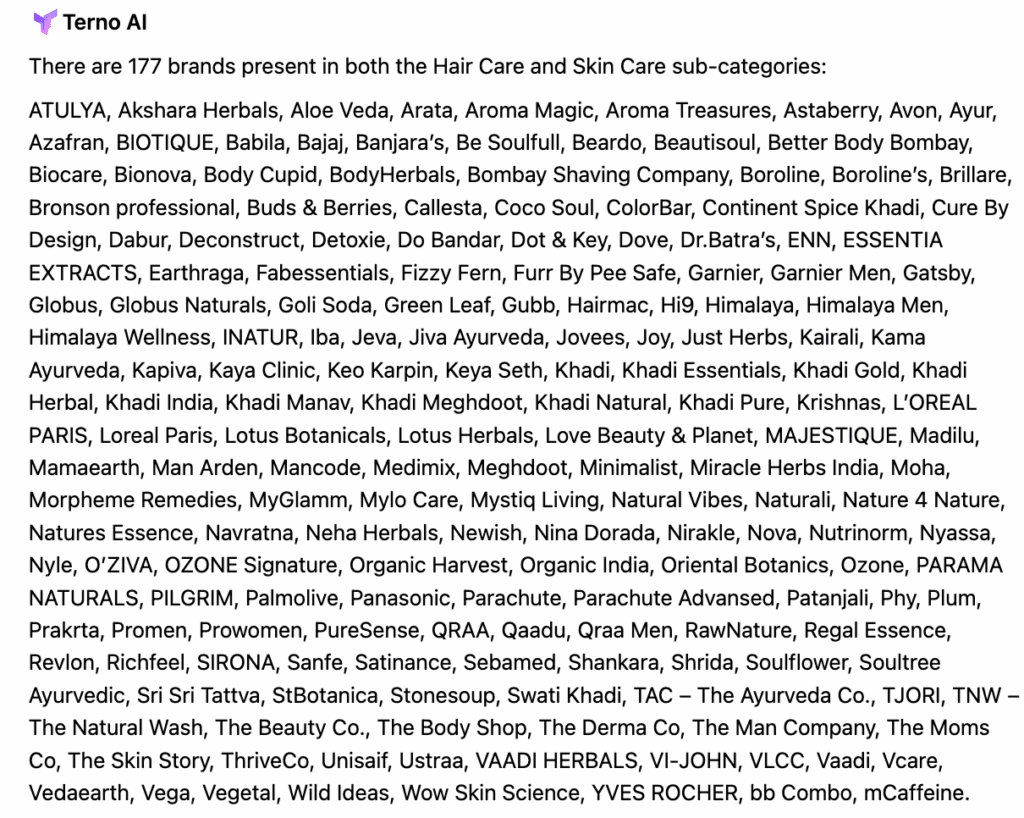
** “Identify brands present in both Hair Care and Skin Care.”

Brands operating across multiple sub-categories typically hold strong brand equity and consumer trust. Identifying these cross-category players highlights potential competitors with broader reach. For businesses, this can inform decisions on whether to expand into adjacent categories (e.g., a hair care brand moving into skincare). Retailers may use this information for cross-selling strategies.
Insight:
- Top 5 brands in Hair Care (by SKUs): Vega, Schwarzkopf, St Botanica, Khadi Natural, Titania
6. Makeup Pricing Tiers
**Prompt:
** “For Makeup sub-category, show the distribution of price ranges (Low <₹200, Mid ₹200–₹600, Premium > ₹600)”

This prompt provides insights into pricing segmentation in the Makeup market. Identifying how many products fall into low, mid, or premium tiers helps businesses design tailored pricing and promotion strategies. For example, if premium products dominate, there may be room to launch affordable variants to attract price-sensitive consumers. Retailers can also adjust inventory to match consumer purchasing power.
Insight:
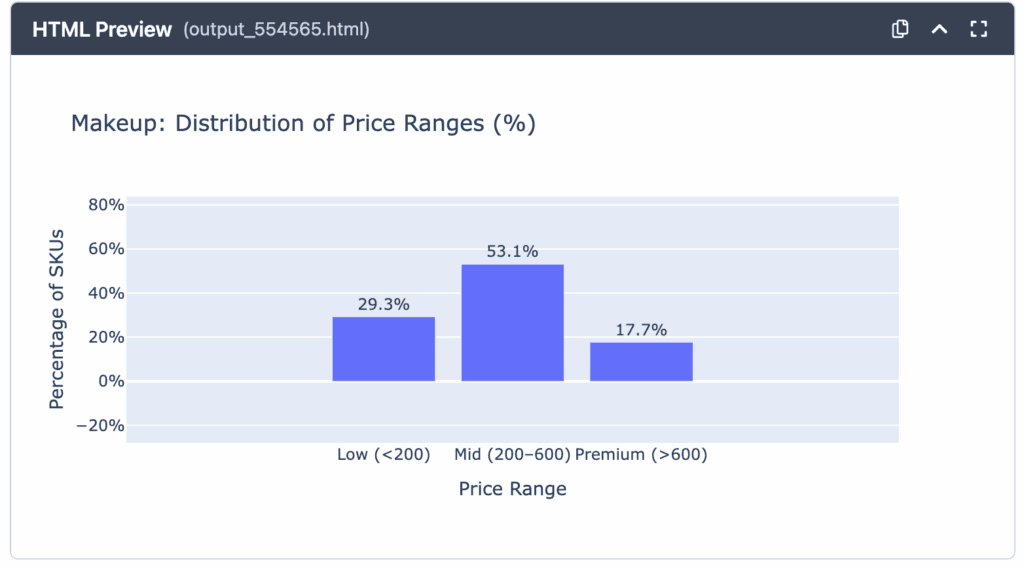
In the Makeup category:
29.27% of SKUs are Low (<₹200)
53.06% are Mid (₹200–₹600)
17.67% are Premium (>₹600)
This highlights a strong mid-market orientation, though premium SKUs are growing.
7. Brand Coverage & SKU Leadership
**Prompt:
** “Display the top 20 brands by number of SKUs, with a bar chart.”

Highlighting the top SKU contributors across all categories reveals brand dominance in the Beauty & Hygiene sector. For FMCG firms, this informs competitive benchmarking, partnership opportunities, and brand positioning strategies. Retailers may leverage this to negotiate better trade terms with leading suppliers while also diversifying their product mix by onboarding smaller brands.
Insight:
**Prompt:
** “Create a boxplot of MRP by brand, top 15 brands only.”

Insight:

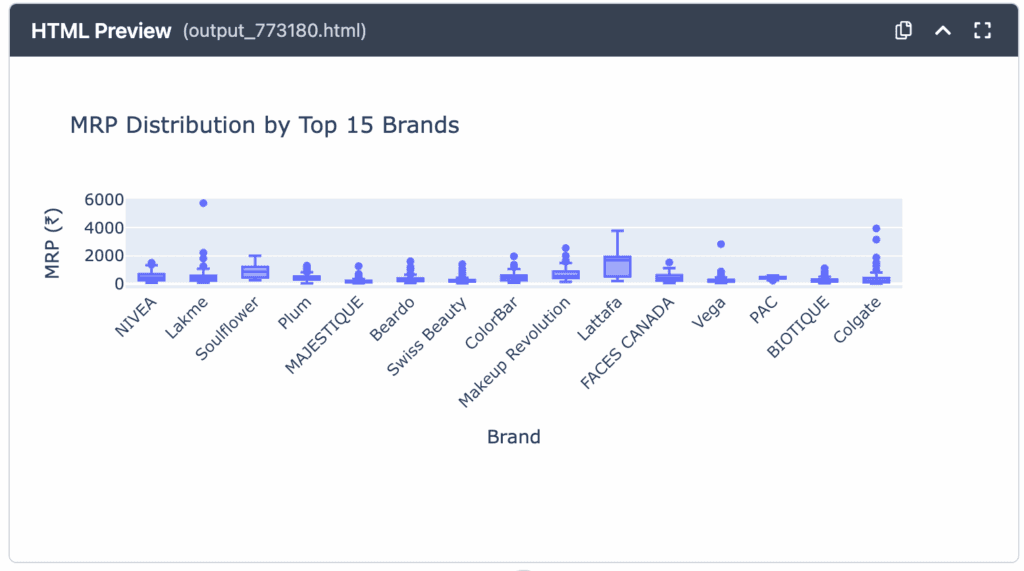
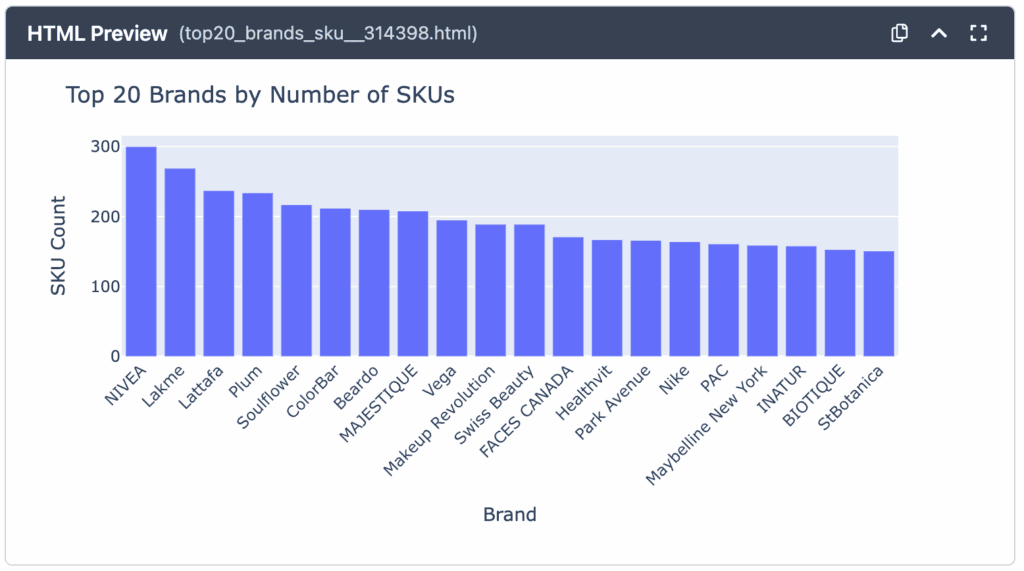
Top 20 brands include: NIVEA (300 SKUs), Lakme (269), Lattafa (237), Plum (234), Soulflower (217).
Together, these account for a large share of the catalog.
8. Price Analysis & Brand Spread
**Prompt:
** “Identify brands with the widest price range (max-min).”

Brands with a wide price spread cater to multiple consumer segments (value, mid-tier, premium). This prompt helps businesses understand which brands are playing across tiers and building wider consumer appeal. Competitors may use this insight to decide whether to compete in all segments or focus narrowly on premium/value niches. Retailers benefit by offering a balanced product mix that caters to diverse consumers.
Insight:
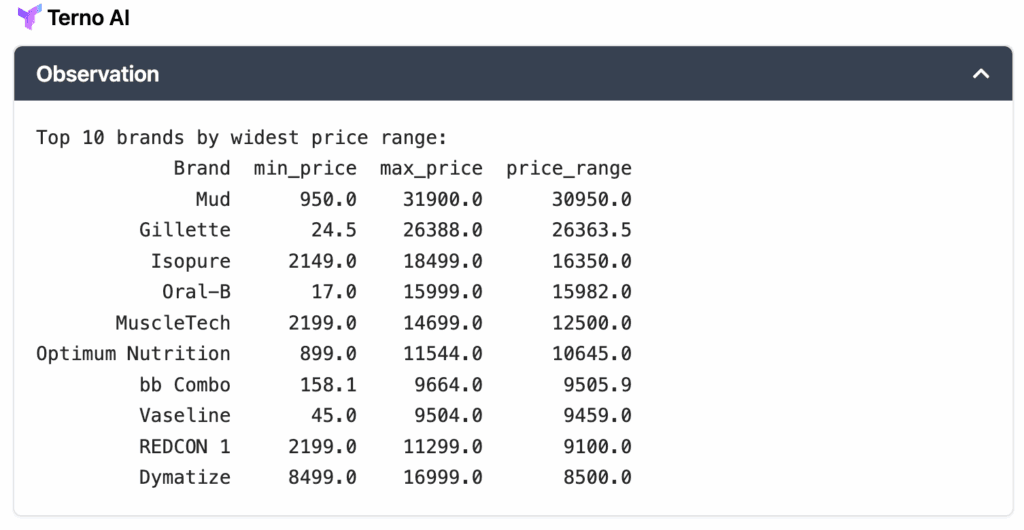
Brands with widest price range:**
**Mud – ₹31,950 spread
Gillette – ₹26,363.5
Isopure – ₹16,350
This indicates tiered strategies across entry-level and premium product lines.
9. Actionable Market Insights
**Prompt:
** “Summarize the overall market structure in bullet points covering category spread, brand dominance, and pricing diversity.”

A concise summary allows decision-makers to quickly grasp the state of the market without needing to dive into raw data. It brings together multiple perspectives—category diversity, leading brands, and price coverage. This is highly valuable for senior management, investors, and strategy teams to make high-level strategic decisions regarding portfolio expansion, pricing adjustments, and competitive positioning.
Insight:
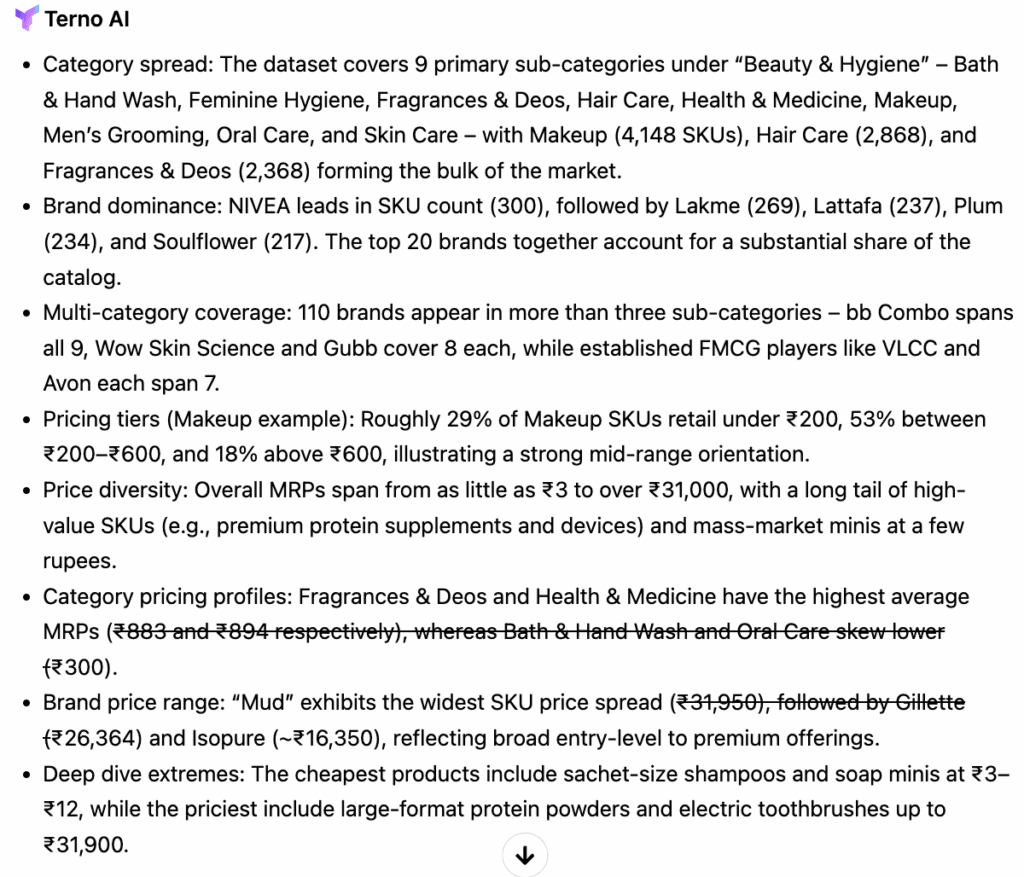
From this analysis, several strategic takeaways emerge:
Category focus: Makeup, Hair Care, and Fragrances should be prioritized for competitive positioning due to SKU dominance.
Brand strategy: Multi-category leaders like NIVEA and Lakme show the importance of portfolio diversification. Smaller brands can expand across categories for growth.
Pricing dynamics: The strong mid-range presence in Makeup shows mass-market affordability, while premium brands can differentiate on quality and lifestyle appeal.
Innovation opportunities: Bath & Hand Wash, Oral Care, and Men’s Grooming remain underrepresented – leaving white space for niche or innovative products.
Portfolio optimization: Broad pricing spreads suggest brands are hedging both affordability and premium trends – a strategy new entrants should consider.
Conclusion
This blog demonstrates how Terno AI transforms raw FMCG datasets into actionable intelligence. By exploring category distribution, brand coverage, and pricing diversity in Big Basket’s Beauty & Hygiene catalog, we gain a clear understanding of:
Where competition is most intense (Makeup, Hair Care, Fragrances)
Which brands dominate across categories (NIVEA, Lakme, Wow Skin Science)
How pricing strategies shape consumer accessibility and premium positioning
For FMCG companies, AI-powered market analysis provides a scalable way to track trends, benchmark competitors, and refine product portfolios in a highly dynamic retail environment.
👉 Explore the full interactive session here: Terno AI Link.

01 April 2026
Introducing Terno AI Desktop: Your AI Data Scientist, Running Locally
The Enterprise Reality: Why Web-Based AI Falls Short Enterprise environments operate under strict security and infrastructure constraints.
18 March 2026
How terno.ai Transforms Fuel Price Forecasting for Better Decisions
The Mystery of Rising Fuel Prices Every time you pull up to a fuel station in Delhi, Mumbai, Chennai, or Kolkata, you’ve probably noticed something: the numbers on the price board never seem to stop climbing. Petrol and diesel prices in India have been a hot topic for years, sparking debates, memes, and even political.

18 March 2026
Empowering Governments with Rapid Data Insights for Better Decisions
A story of bureaucratic gridlock, data insights, and the moment everything changed Access chat here The Crisis: India's Identity System in Data Purgatory Picture this: It's October 2025. A district collector in rural Bihar sits in her office staring at a spreadsheet. Aadhaar enrollment in her district has been dropping for three months. Is it