The Mystery of Rising Fuel Prices
Every time you pull up to a fuel station in Delhi, Mumbai, Chennai, or Kolkata, you’ve probably noticed something: the numbers on the price board never seem to stop climbing. Petrol and diesel prices in India have been a hot topic for years, sparking debates, memes, and even political discussions. But have you ever wondered what really drives these prices? Are they influenced by global crude oil trends? Do holidays and seasons play a role? And most importantly, can we predict where they’re headed next?
Enter terno.ai, an automated data scientist that doesn’t just crunch numbers it thinks, analyzes, and even predicts like a seasoned data expert. In this blog, I'll take you behind the scenes of a groundbreaking case study where terno.ai unraveled the complexities of India’s fuel pricing, uncovered hidden patterns, and built a model to forecast future prices. By the end, you’ll see how AI isn’t just changing data science, it’s making it accessible, insightful, and downright fascinating.
1. Seamless Data Ingestion and Cleaning
Automated Data Loading
Drag, Drop, Analyze: Terno allows users to upload raw datasets (CSV, Excel, etc.) directly into the platform. There’s no need to write code for basic data loading.
Instant Inspection: The moment the data is uploaded, Terno.AI automatically infers data types, checks for missing values, and generates a summary statistics report. For the fuel price dataset, it immediately recognized columns like Date, City, Fuel Type, and Price, and flagged any inconsistencies.
Smart Data Cleaning
Standardization: Terno.AI automatically standardizes column names (e.g., converting Petrol_price_in_Delhi_per_litre_INR to petrol_price). This eliminates the manual grunt work of renaming columns.
Handling Missing Data: Instead of writing code to fill or drop missing values, Terno.AI suggests optimal strategies based on the data’s distribution. For example, it might recommend interpolating missing prices based on neighboring dates.
Date-Time Conversion: Dates stored as text? Terno.AI converts them to datetime objects and even suggests useful extractions (e.g., creating Year, Month, Day columns).
Why It’s Advanced:Time Savings: What used to take hours now happens in seconds.
Error Reduction: Automation minimizes human errors in data preparation.
2. Intelligent Exploratory Data Analysis (EDA)
Automated Visualizations
One-Click Charts: Terno.AI automatically generates relevant visualizations,line charts for trends, bar charts for comparisons, and histograms for distributions. For the fuel dataset, it created:
A time-series plot of average monthly prices.
A bar chart comparing prices across metro cities.
Interactive Dashboards: Users can drill down into charts, zoom in on specific time periods, or filter by city or fuel type,all without writing a single line of code.
Insight Generation
Pattern Detection: Terno.AI doesn’t just plot data; it identifies trends, outliers, and correlations. For example, it highlighted the upward trend in fuel prices and the consistent price gap between petrol and diesel.
Natural Language Insights: Terno.AI explains findings in plain English, such as:
"Petrol prices in Mumbai are consistently 2-3 INR higher than in Delhi, likely due to higher local taxes."
Why It’s Advanced:
Democratizes EDA: Non-technical users can explore data and uncover insights without coding.
Faster Iteration: Rapid visualization accelerates the discovery of patterns.
The First Visualizations: Painting the Big Picture
Terno.AI generated two key charts to visualize the data:
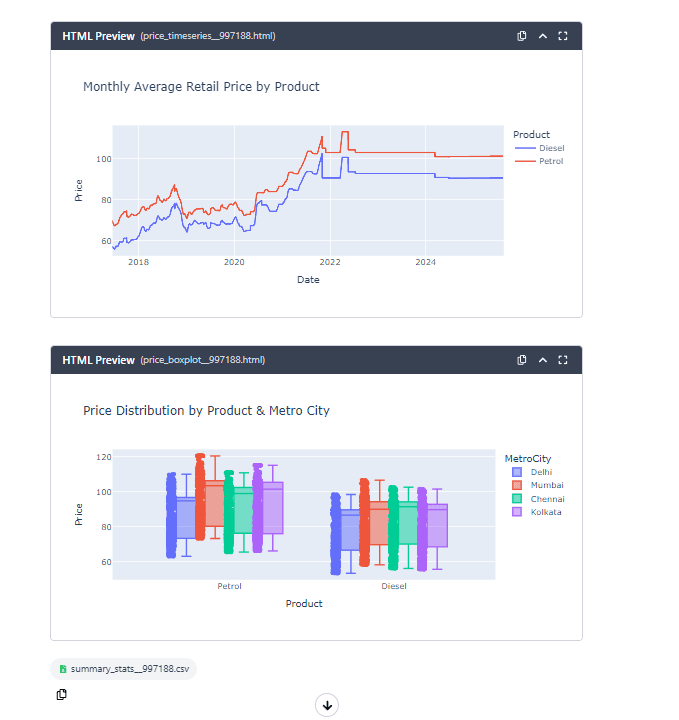
1. Average Monthly Retail Prices (2018–2024):
A line chart revealed a steady upward climb in fuel prices, with petrol consistently priced higher than diesel.
Key Observation: Prices didn’t just rise,they surged, especially around global events like the 2020 oil price crash and the post-pandemic recovery.
2. Price Comparison Across Metro Cities:A bar chart showed that Mumbai had the highest average prices, followed by Chennai, Delhi, and Kolkata.
Why? Local taxes and transportation costs add layers to the base price, making fuel more expensive in some cities than others.
3. Effortless Feature Engineering
Automated Feature Creation
Temporal Features: Terno.AI extracts time-based features (month, day of the week, quarter) automatically. This is critical for analyzing seasonality.
External Data Integration: Need to incorporate Brent crude prices or holiday calendars? Terno.AI fetches and merges external datasets with minimal user input. For the fuel analysis, it:
Pulled Brent crude prices from Yahoo Finance.
Flagged Indian public holidays using a built-in calendar.
Aligned all datasets by date, accounting for time lags.
Contextual Suggestions
- Terno.AI recommends features that might improve analysis. For example:
"Adding a ‘lagged crude price’ feature could help analyze the delay between global oil prices and local fuel prices."
Seasonality: Do Prices Dance to the Calendar?
Terno.AI broke down the data by month, day, and holiday status:
Monthly Trends: Prices tended to peak in May and dip slightly in December.
Day-of-Week Effects: Surprisingly, no significant difference,Sunday prices weren’t lower, despite common beliefs.
Holiday Impact: After running statistical tests, Terno.AI concluded: holidays don’t move the needle. Prices on Diwali were just as high (or low) as any other day.
The Lag Effect: How Long Until Global Shocks Hit Home?
This was the big reveal. Terno.AI calculated cross-correlations between Brent crude prices and retail fuel prices, testing lags from -60 to +60 days.
Petrol: Changes in crude prices took 7 days to reflect at the pump.
Diesel: The delay was 8 days.
Why Does This Matter? If global oil prices spike today, you’ll feel it at the pump in about a week.
4. Model Building and Forecasting: The Power of Automation
Automated Model Selection
Smart Recommendations: Terno.AI evaluates the dataset and suggests the best models for the task. For time-series forecasting, it recommended Facebook’s Prophet due to its strength in handling seasonality and holidays.
No Coding Required: Users don’t need to write model training code. Terno.AI automatically fits the model to the data, including:
Yearly and weekly seasonality.
Holiday effects.
Custom changepoints for significant events (e.g., tax changes or global oil shocks).
Hyperparameter Optimization
- Terno.AI automatically tunes hyperparameters to optimize forecast accuracy. For Prophet, it adjusted parameters like seasonality_prior_scale and changepoint_prior_scale based on the data’s characteristics**.**
Forecasting and Uncertainty
**90-Day Predictions: **With a click, Terno.AI generated forecasts for the next 90 days, including confidence intervals (yhat_lower, yhat_upper).
Interpretable Outputs: The forecast isn’t just a black box,Terno.AI explains the model’s components (trend, seasonality, holidays) and their impact on predictions.
5. Deployment and Communication: Insights for Everyone
Exportable Results
CSV and Visual Reports: Terno.AI allows users to export forecasts, charts, and insights in formats ready for presentations or further analysis.
Interactive Reports: Stakeholders can explore results dynamically, filtering forecasts by city or fuel type.
Natural Language Summaries
- Terno.AI generates executive summaries of key findings, such as:
"Fuel prices in Delhi are forecasted to rise by 1.5 INR/L over the next 30 days, with a 7-day lag from global crude price changes."
The Terno.AI Advantage: A Side-by-Side Comparison
| Task | Traditional Data Science | Terno.AI |
|---|---|---|
| Data Loading | Manual coding (Pandas, SQL). | Drag-and-drop upload. |
| Data Cleaning | Hours of manual cleaning and scripting. | Automated cleaning and standardization. |
| EDA | Custom code for visualizations; iterative refinement. | One-click charts and automated insights. |
| Feature Engineering | Manual creation of features; external data integration requires coding. | Automated feature extraction and merging. |
| Model Selection | Requires statistical expertise; trial and error. | AI-recommended models; no coding needed. |
| Forecasting | Manual tuning and validation. | Automated forecasting with uncertainty intervals. |
| Deployment | Collaboration with engineers; complex pipelines. | Exportable reports and interactive dashboards. |
| Time to Insight | Days to weeks. | Minutes to hours. |
Real-World Impact: How Terno.AI Changed the Game for Fuel Price Analysis
1. Speed: From Weeks to Minutes
Before: A team of data scientists might spend weeks cleaning data, building models, and generating forecasts.
With Terno.AI: The entire analysis,from raw data to forecast,was completed in hours.
**2. Accessibility: **
Before: Only trained data scientists could perform this analysis.
With Terno.AI: Business analysts, policymakers, or even curious individuals can derive insights without deep technical knowledge.
3. Accuracy: Reducing Human Error
Before: Manual processes risked errors in data cleaning, merging, or modeling.
With Terno.AI: Automation ensures consistency and reliability in results.
4. Scalability: Handle Bigger, Complex Datasets
- Terno.AI’s cloud-based infrastructure can process larger datasets and more complex models than a single data scientist working locally.
5. Cost-Effective: Lowering the Barrier to Entry
Before: Hiring a team of data scientists is expensive.
With Terno.AI: Organizations reduce costs while gaining deeper, faster insights.
The Future of Data Science: Augmented Intelligence
Terno.AI doesn’t replace data scientists,it augments their capabilities. By automating repetitive tasks, it frees up experts to focus on strategic questions and innovative solutions. For businesses, this means:
Faster decision-making with real-time insights.
Democratized data science, empowering more team members to explore data.
Scalable analytics, enabling organizations to analyze more datasets and uncover hidden opportunities.
Conclusion: Why Terno.AI Is a Game-Changer
The fuel price case study is just one example of how Terno.AI transforms raw data into actionable intelligence. By automating the heavy lifting,data cleaning, EDA, feature engineering, modeling, and deployment,it makes advanced analytics accessible to everyone.
Key Takeaways:
Automation Accelerates Insights: What took weeks now takes hours.
Democratizes Data Science: No coding? No problem.
Enhances Accuracy: Reduces human error and bias.
Empowers Decision-Making: Clear, actionable insights for all stakeholders
01 April 2026
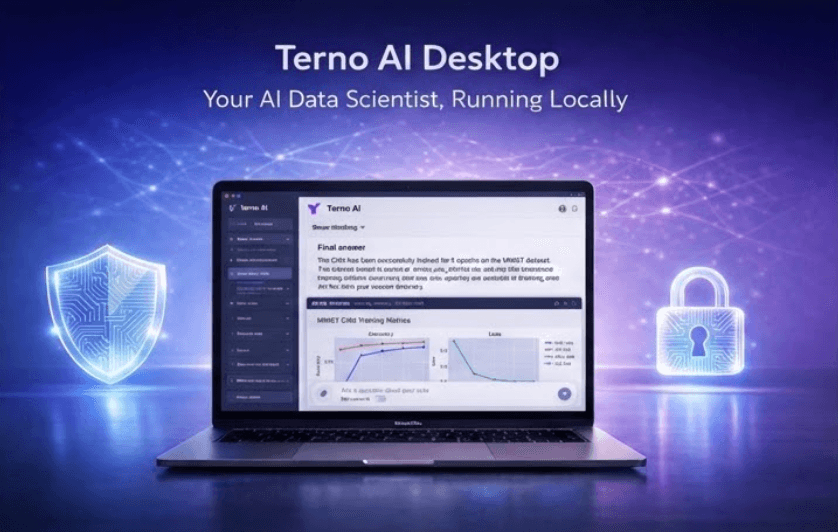
Introducing Terno AI Desktop: Your AI Data Scientist, Running Locally
The Enterprise Reality: Why Web-Based AI Falls Short Enterprise environments operate under strict security and infrastructure constraints.

18 March 2026
Empowering Governments with Rapid Data Insights for Better Decisions
A story of bureaucratic gridlock, data insights, and the moment everything changed Access chat here The Crisis: India's Identity System in Data Purgatory Picture this: It's October 2025. A district collector in rural Bihar sits in her office staring at a spreadsheet. Aadhaar enrollment in her district has been dropping for three months. Is it

04 March 2026
Mastering Loan Risks with Al: The New Standard in Micro-Decisioning
Mastering Loan Risks with Al: The New Standard in Micro-Decisioning A story of AI, intuition, and the art of saying "yes" to the right people The Gut-Wrenching Decision It's 3 PM on a Friday. Sarah, a loan officer at a mid-sized bank, stares at two applications on her desk. Both applicants want $15,000. Both have […]