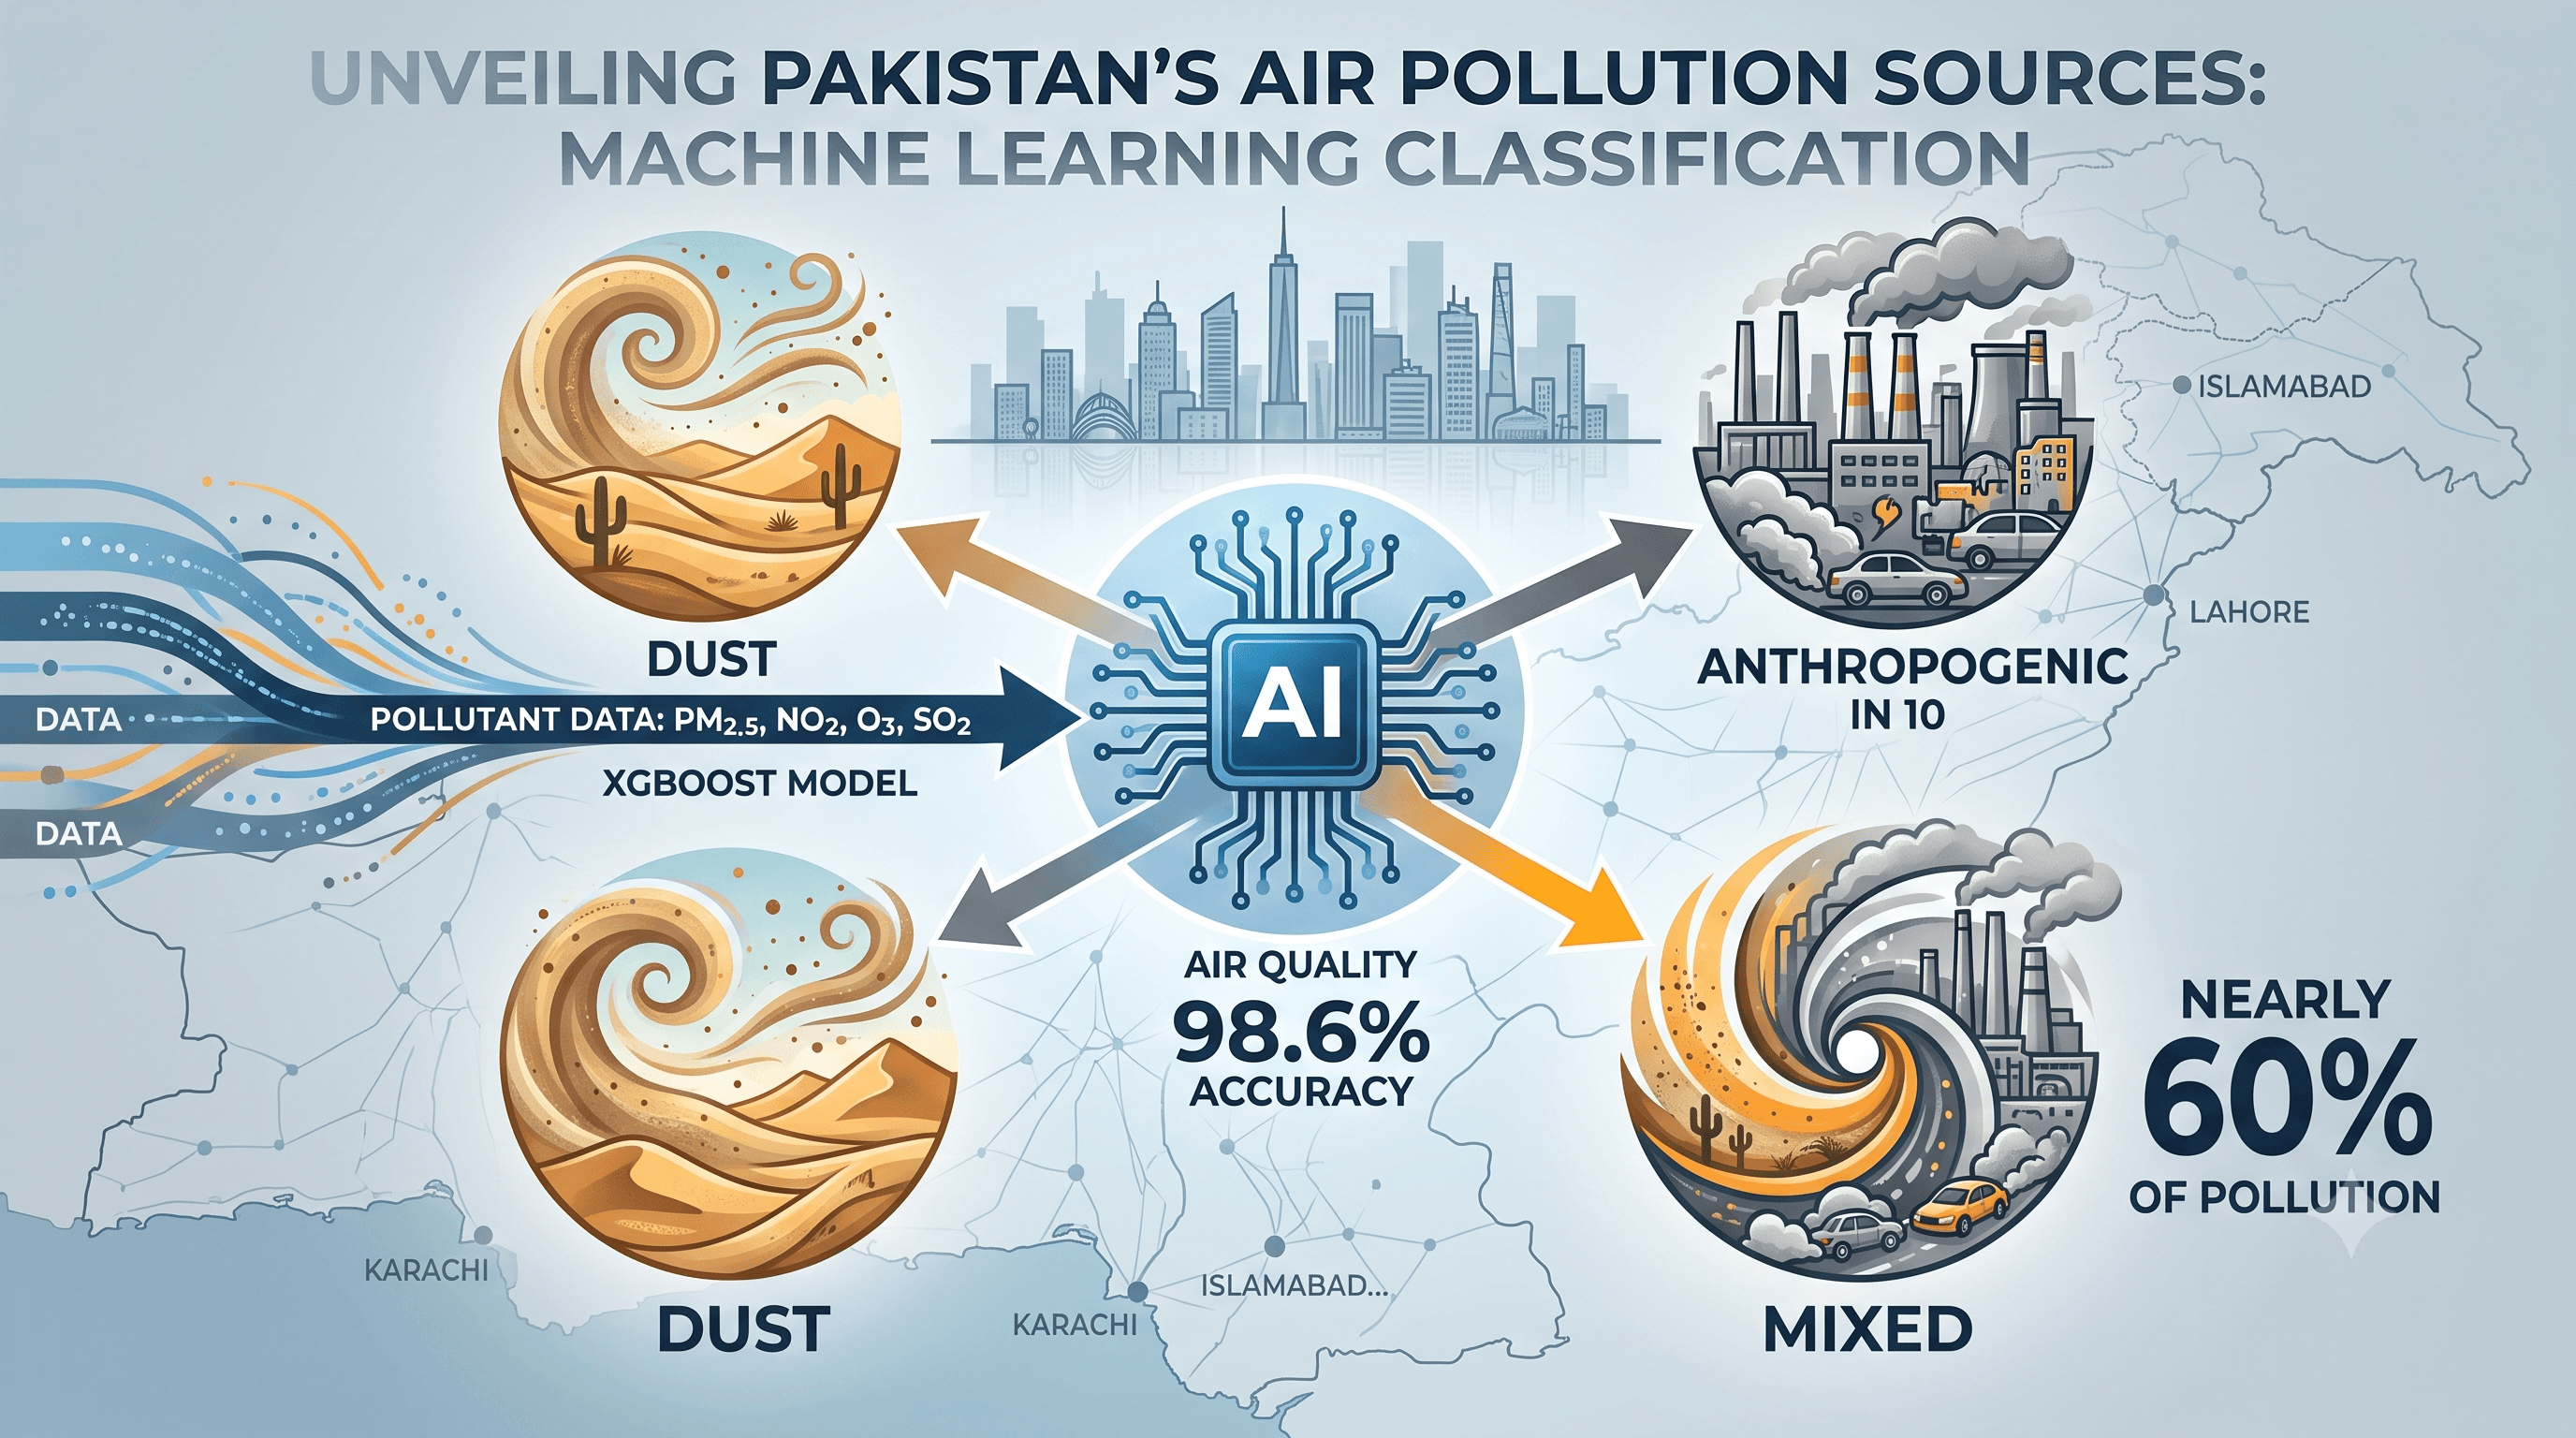
Can You Tell Dust From Traffic Fumes Just by Looking at the Numbers? A Machine Learning Approach to Classifying Air Pollution in Pakistan
Air quality monitors are everywhere these days — on rooftops, at street corners, even in phone apps — quietly reporting numbers like PM2.5, PM10, NO2, CO, O3, and SO2. But here's the catch: those numbers tell you how polluted the air is, not why. Is that hazy sky over Lahore caused by a dust storm rolling in from the desert, or is it traffic and industry choking the air? Standard monitoring systems don't say.
This is exactly the gap a recent data-driven study set out to close. Using air quality data from ten cities across Pakistan, the research builds a machine learning pipeline that classifies pollution into three types — Dust, Anthropogenic (human-caused), and Mixed — using nothing more than the pollutant readings we already collect. No chemical composition analysis. No specialized instruments. Just smart feature engineering and the right model.
Here's a breakdown of how it works, what it found, and why it matters.
The Problem: Numbers Without Context
Most air quality systems measure concentration, not origin. You get a PM2.5 reading, but not an explanation. Traditional methods for identifying pollution sources — chemical composition analysis, receptor models — exist, but they're expensive, complex, and require specialized data that most monitoring networks simply don't have.
At the same time, most machine learning research in this space has focused on predicting pollutant levels, not classifying pollution type. And the studies that do attempt classification often produce models that are accurate but opaque — black boxes that can't explain their own reasoning, which is a problem when the whole point is to inform real-world environmental decisions.
So the research question became: Can we classify pollution type using only the pollutant data we already have, in a way that's both accurate and interpretable?
The Approach
The study used an air quality dataset covering Pakistan from November 2025 to February 2026 — 21,840 hourly rows of data across 10 cities, including particulate matter (PM2.5, PM10), gaseous pollutants (NO2, CO, O3, SO2), and spatial/temporal information. The whole pipeline was built on the Terno AI platform, which combines data analysis, model development, and interpretation in one workflow.
The methodology followed six broad steps:
Analyzing pollutant distributions and relationships
Engineering new variables that capture pollution characteristics
Applying an initial rule-based classification
Training machine learning models to generalize that classification
Interpreting the models with explainability techniques
Mapping results geographically and over time
Feature Engineering: Teaching the Model to "See" Pollution Type
The key insight is that dust and human-caused pollution leave different fingerprints in the data. Three engineered features made those fingerprints visible:
PM Ratio — the ratio of fine to total particulate matter:
PM_ratio = PM2.5 / PM10
A high ratio points to fine-particle dominance (typical of anthropogenic pollution); a low ratio points to coarse-particle dominance (typical of dust).
Coarse Particulate Matter — the leftover coarse fraction:
PM_coarse = PM10 − PM2.5
Higher values here mean a stronger dust contribution.
Gas-to-Particle Ratios — NO2/PM10 and CO/PM10 — which help flag anthropogenic emission patterns, since traffic and industrial activity tend to produce more gaseous pollutants relative to particulate matter.
Rule-Based Classification: A Simple, Interpretable Starting Point
Before any machine learning happened, each data point was first labeled using straightforward, human-readable rules:
Dust: high PM10, low PM2.5/PM10 ratio, relatively low gaseous pollutants
Anthropogenic: high PM2.5/PM10 ratio and/or elevated gaseous pollutants
Mixed: everything that doesn't clearly fit the other two
This rule-based layer gives the study an interpretable baseline — and it becomes the label set that the machine learning models are then trained to reproduce and generalize.
Training the Models
Three models were trained and compared:
Decision Tree
Random Forest
XGBoost
Rather than randomly shuffling the data, the researchers used a time-based split — training on the earlier 80% of the data and testing on the later 20%. This matters because it mimics real-world deployment: the model is evaluated on future observations it hasn't seen, not just a random slice of the past.
Because the Dust class made up only about 2% of the dataset, Macro F1-score was chosen as the primary evaluation metric instead of plain accuracy — it treats every class equally, so a model can't hide poor performance on rare classes behind strong performance on common ones.
The Results
Pollution Is Mostly a Blend, Not a Single Source
The rule-based classification revealed something worth pausing on: pollution in Pakistan isn't dominated by one clear cause.
| Pollution Type | Percentage |
|---|---|
| Mixed | ~60% |
| Anthropogenic | ~38% |
| Dust | ~2% |
Nearly 60% of observations fell into the "Mixed" category — meaning air quality is usually shaped by both natural and human factors simultaneously, not a single dominant source.
Pollutants Move Together — Except Ozone
A correlation analysis across the six pollutants surfaced some clear patterns:
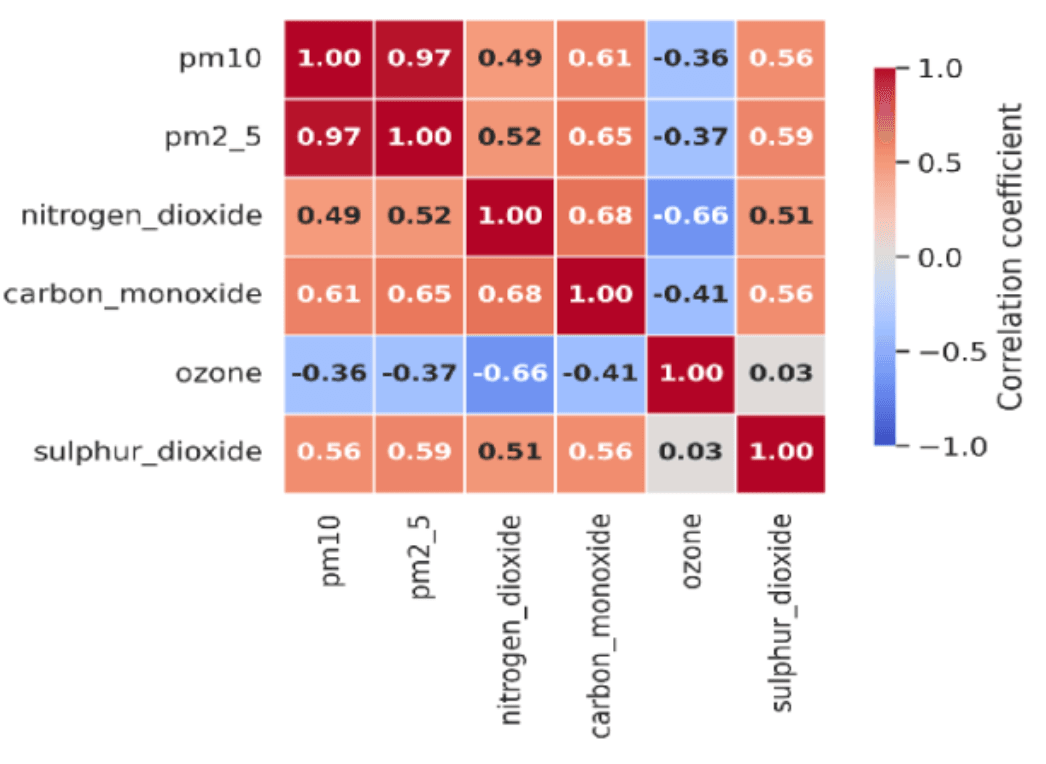
PM2.5 and PM10 are almost perfectly correlated (0.97) — fine and coarse particles rise and fall together.
NO2 and CO show moderate positive correlation with particulate matter, suggesting shared urban pollution sources.
Ozone (O3) is the outlier — it's negatively correlated with almost everything, especially NO2 (-0.66), reflecting the different atmospheric chemistry that governs ozone formation.
SO2 shows moderate positive correlation with both particulate and gaseous pollutants.
These interlocking relationships are exactly why feature engineering and machine learning add value here — the pollution "signal" isn't found in any single variable, but in the pattern across all of them.
XGBoost Comes Out on Top
Across every metric tested, XGBoost outperformed both Random Forest and Decision Tree:
| Model | CV Macro F1 (Mean) | Test Accuracy | Macro F1-score | Weighted F1-score |
|---|---|---|---|---|
| Decision Tree | 0.786 | 0.930 | 0.829 | 0.941 |
| Random Forest | 0.951 | 0.976 | 0.900 | 0.973 |
| XGBoost | 0.971 | 0.986 | 0.956 | 0.986 |
XGBoost hit a test accuracy of 0.986 and a macro F1-score of 0.956, with a cross-validation macro F1 of 0.971 and low variance — a strong signal that the model generalizes well rather than just memorizing patterns in the training data.
Digging Into the Rare Class: Can It Actually Catch Dust Events?
Since Dust events are rare (only ~2% of the data), the real test of the model isn't overall accuracy — it's whether it can still catch that minority class.
| Class | Precision | Recall | F1-score | Support |
|---|---|---|---|---|
| Anthropogenic | 0.99 | 1.00 | 0.99 | 1220 |
| Dust | 0.98 | 0.81 | 0.89 | 206 |
| Mixed | 0.99 | 0.99 | 0.99 | 2942 |
The Anthropogenic and Mixed classes were classified almost perfectly. Dust detection, while a bit harder — recall of 0.81 — is still strong, especially considering how underrepresented the class is in the data.
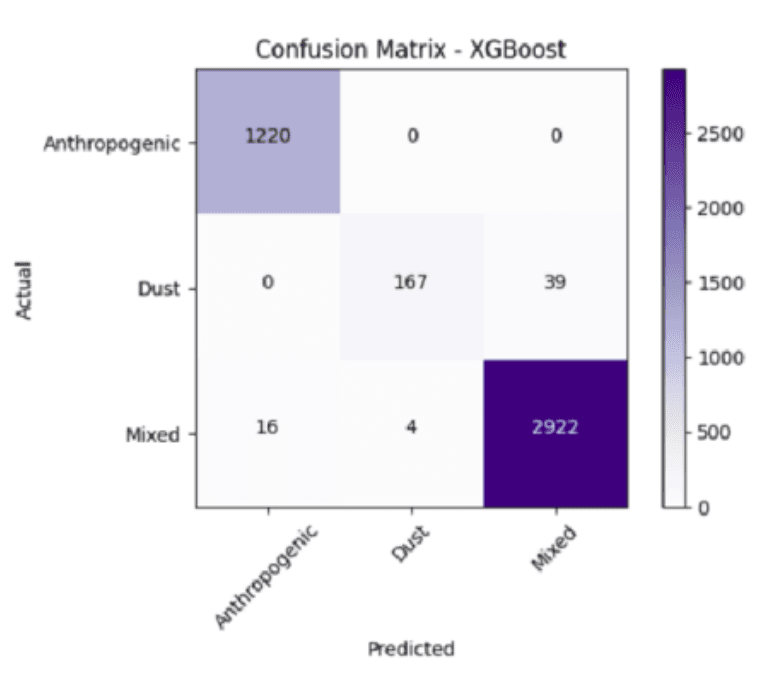
The confusion matrix tells a coherent story: Anthropogenic instances were classified with zero misclassification, Mixed instances were highly accurate with only minor confusion, and the errors that did occur were mostly Dust instances mislabeled as Mixed — which makes physical sense, since dust events often occur alongside some level of background human-caused pollution rather than in isolation.
Opening the Black Box: What Is the Model Actually Learning?
To make sure the model wasn't just a high-performing black box, the researchers applied SHAP (SHapley Additive exPlanations) analysis to understand which features were driving each classification.
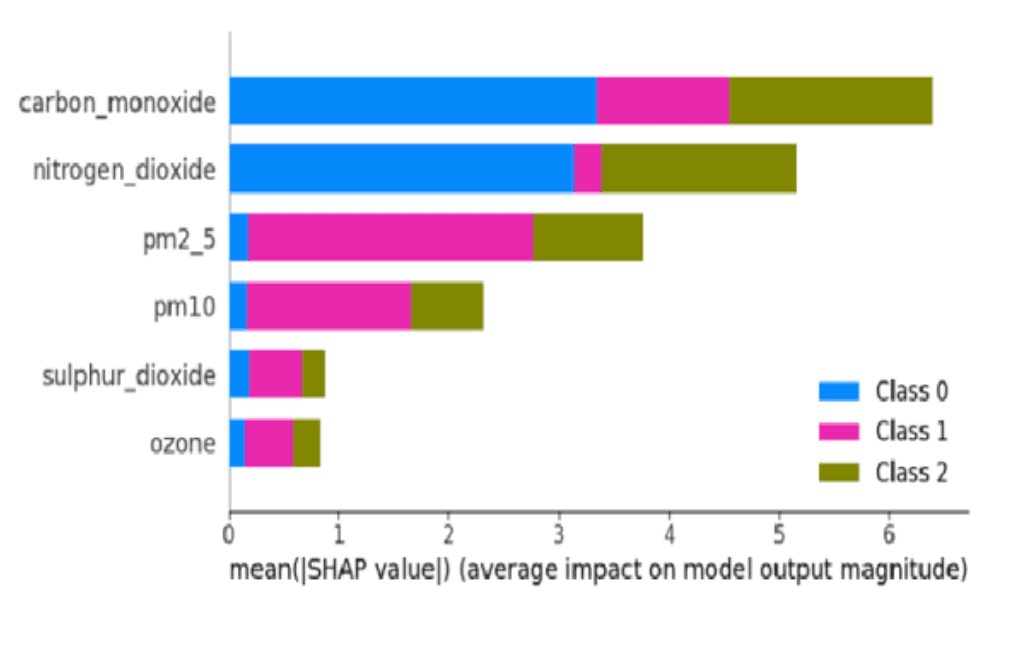
The findings lined up with real-world environmental science:
Carbon monoxide (CO) and nitrogen dioxide (NO2) were the most influential features overall — and higher values of both point strongly toward Anthropogenic pollution.
PM10 was the key signal for identifying Dust events.
Mixed classifications tended to emerge from intermediate or combined patterns across these variables.
In other words, the model isn't just pattern-matching noise — it's picking up on the same physical relationships an atmospheric scientist would expect to see.
Where Pollution Types Show Up Geographically
Mapping the classifications onto Pakistan's ten cities revealed clear spatial patterns: anthropogenic pollution concentrated in urban centers, Mixed pollution dominant almost everywhere, and Dust largely confined to specific regions.
| City | Anthropogenic (%) | Dust (%) | Mixed (%) |
|---|---|---|---|
| Faisalabad | 63.83 | 0.14 | 36.03 |
| Islamabad | 45.88 | 0.00 | 54.12 |
| Karachi | 19.05 | 1.51 | 79.44 |
| Lahore | 73.08 | 0.00 | 26.92 |
| Multan | 42.45 | 0.23 | 57.33 |
| Peshawar | 44.92 | 0.00 | 55.08 |
| Quetta | 0.00 | 20.10 | 79.90 |
| Rahim Yar Khan | 0.14 | 0.69 | 99.18 |
| Rawalpindi | 60.81 | 0.00 | 39.19 |
| Sialkot | 27.38 | 0.00 | 72.62 |
A few standouts:
Lahore (73.08%) and Faisalabad (63.83%) show the highest shares of Anthropogenic pollution — consistent with heavy traffic and industrial activity in those urban centers.
Quetta is the clear exception on Dust, at 20.10% — dramatically higher than any other city, pointing to strong region-specific natural pollution drivers (likely tied to its arid, dust-prone geography).
Rahim Yar Khan (99.18%), Karachi (79.44%), and Sialkot (72.62%) show heavy Mixed classifications, suggesting these locations experience a genuine blend of natural and human-driven pollution rather than one dominant cause.
Key Takeaways
- Pollution is rarely one thing. Nearly 60% of observations across the dataset fall into the "Mixed" category — air quality is usually shaped by overlapping natural and human factors, not a single source.
- Urban activity leaves a clear fingerprint. Cities with heavy traffic and industry (Lahore, Faisalabad) show significantly more Anthropogenic pollution.
- Dust pollution is regional, not universal. At ~2% overall, Dust is rare — except in places like Quetta, where geography clearly plays a bigger role.
- XGBoost delivers both accuracy and reliability. A 0.986 test accuracy and 0.956 macro F1-score, with strong cross-validation stability, shows the model generalizes rather than overfits.
- Rare-class detection still works. Despite Dust representing only 2% of the data, the model still achieved a recall of 0.81 for that class — meaningful for catching real, if infrequent, dust events.
- The model's reasoning holds up. SHAP analysis confirmed that CO and NO2 drive Anthropogenic classifications while PM10 drives Dust classifications — matching known atmospheric science rather than picking up on spurious patterns.
- You don't need specialized instruments to do this. The entire approach relies on standard pollutant measurements that most monitoring networks already collect.
Why This Matters
The bigger implication here isn't just "we built an accurate classifier." It's that pollution type — not just pollution level — can now be inferred from data that's already being collected at scale, without expensive chemical analysis or new hardware. That opens the door to more targeted environmental policy: a city dealing primarily with anthropogenic pollution needs traffic and industrial interventions, while a region facing frequent dust events needs a completely different response, like land management or early-warning systems.
As the researchers note, future work could extend this by folding in meteorological variables, testing on larger multi-region datasets, and eventually working toward real-time pollution-type monitoring — turning this from a retrospective analysis tool into something that could inform decisions as pollution events are actually unfolding.
Read the full white paper here:

18 August 2026
The Honest Number Was 83%: Leakage, Abstention, and a Complaint Router You Can Actually Deploy
The same complaint-routing model scores 96.3% or 83.2% depending on which three columns you leave in the training data. The high number is the intake form being read back to you. This is what the leakage audit found before a single model was trained, why 83.2% is the honest figure, and how the same model — given permission to say "I don't know" — becomes deployable at 90.7% accuracy on 79.5% of traffic.

29 July 2026
EdgeGuard: AI-Driven Predictive Maintenance for Power Transformers
Power transformers are among the most critical assets in electrical distribution infrastructure. Their unexpected failure can result in power outages, safety hazards, equipment damage, expensive repairs, and long service interruptions. Traditional transformer maintenance practices often rely on periodic manual inspection, offline testing, or run-to-failure maintenance. These methods are expensive, slow, labor-intensive, and unable to detect rapidly developing faults in real time. EdgeGuard is an AI-driven, edge-computing predictive maintenance system designed to continuously monitor transformer health and forecast failures before catastrophic damage occurs. The system acts as a retrofittable “Digital Doctor” for distribution transformers by combining low-cost industrial sensors, an ESP32 microcontroller, local intelligence, machine learning-based risk prediction, autonomous relay control, and a real-time web dashboard. The proposed system monitors six major transformer health indicators: temperature, humidity, vibration, oil level, current, and voltage. These signals are normalized and processed through a Multi-Layer Perceptron neural network to classify transformer condition and estimate failure risk. If the predicted risk crosses a critical threshold of 80%, EdgeGuard automatically triggers a relay through GPIO 26 to isolate the transformer from the electrical network. The system also supports secure remote control, dashboard monitoring, API-key-based hardware authentication, JWT-based user access, WebSocket live updates, and automatic live-hardware detection. With an estimated deployment cost of approximately ₹3,850, EdgeGuard offers a low-cost alternative to conventional transformer monitoring systems. Its cloud-independent operation and edge-based decision-making make it especially useful for rural and semi-urban distribution grids where connectivity and maintenance resources are limited.

28 July 2026
ANALYZING TOXIC USER BEHAVIOR AND RISK PATTERNS IN ONLINE GAMING PLATFORMS
This study shows that behavioral data alone can't reliably predict gaming toxicity — but a risk-based model combining behavioral and engineered features does a much better job of flagging the small segment of high-risk users driving disproportionate harm.