
Predicting patterns to detect medical insurance frauds using machine learning models
A data-driven fraud detection framework to identify anomalous insurance claims and improve healthcare payment integrity through predictive analytics.
Disclaimer: This is a purely data science study based on publicly available datasets. Any relation found with the real world is unintentional and coincidental. The maker or the evaluator of this report holds no responsibility.
Abstract
This project presents an end-to-end Medicare fraud detection framework using machine learning techniques applied to publicly available CMS DESYNPUF healthcare claims data. The study integrates Medicare beneficiary summary data with inpatient claims data to construct a unified claim-level analytical dataset enriched with demographic, clinical, and financial information. A comprehensive feature engineering workflow was developed to generate predictive variables including diagnosis count, procedure count, chronic condition burden, payment-per-day ratios, procedure density, and composite healthcare complexity scores.
Three machine learning models were evaluated: Logistic Regression, Random Forest, and XGBoost. Synthetic fraud labels were generated using rule-based heuristics and anomaly detection approaches due to the absence of real-world fraud labels in public healthcare datasets. The research additionally incorporated SHAP interpretability analysis, fairness auditing, provider-level risk concentration analysis, and deployment readiness assessment.
The findings indicate that XGBoost provides the strongest predictive capability while Logistic Regression offers the highest interpretability for compliance-sensitive environments. Random Forest provided moderate performance but limited additional value relative to XGBoost. The project also included the development of an interactive UI/UX deployment prototype using Terno AI-trained models hosted on Hugging Face to demonstrate real-world fraud scoring usability.
Keywords: Terno AI, Fraud, Medicare, Machine learning, SHAP, Analytics, UI/UX
Contents
Executive Summary
Introduction
Research Objectives
Data Source and Dataset Description
Methodology
Exploratory Data Analysis (EDA)
Synthetic Fraud Labeling and Validation Framework
Machine Learning Model Development and Evaluation
Fraud Risk Scoring System
Bias, Fairness, and Ethical Risk Assessment
Conclusion
Future Work and Recommendations
FairClaim AI Dashboard and UI/UX
References
Glossary of Terms
1. Executive Summary
This report presents the end-to-end development, preparation, evaluation, and deployment-oriented assessment of a Medicare false insurance claim detection system using machine learning techniques. The project integrates Medicare beneficiary summary data with inpatient claims data to construct a unified claim-level analytical dataset enriched with demographic, clinical, and financial information. A structured feature engineering workflow was implemented to generate model-compatible variables required for fraud prediction, enabling inference on previously unseen Medicare claims.
Three machine learning models were evaluated within the framework:
XGBoost
Random Forest
Logistic Regression
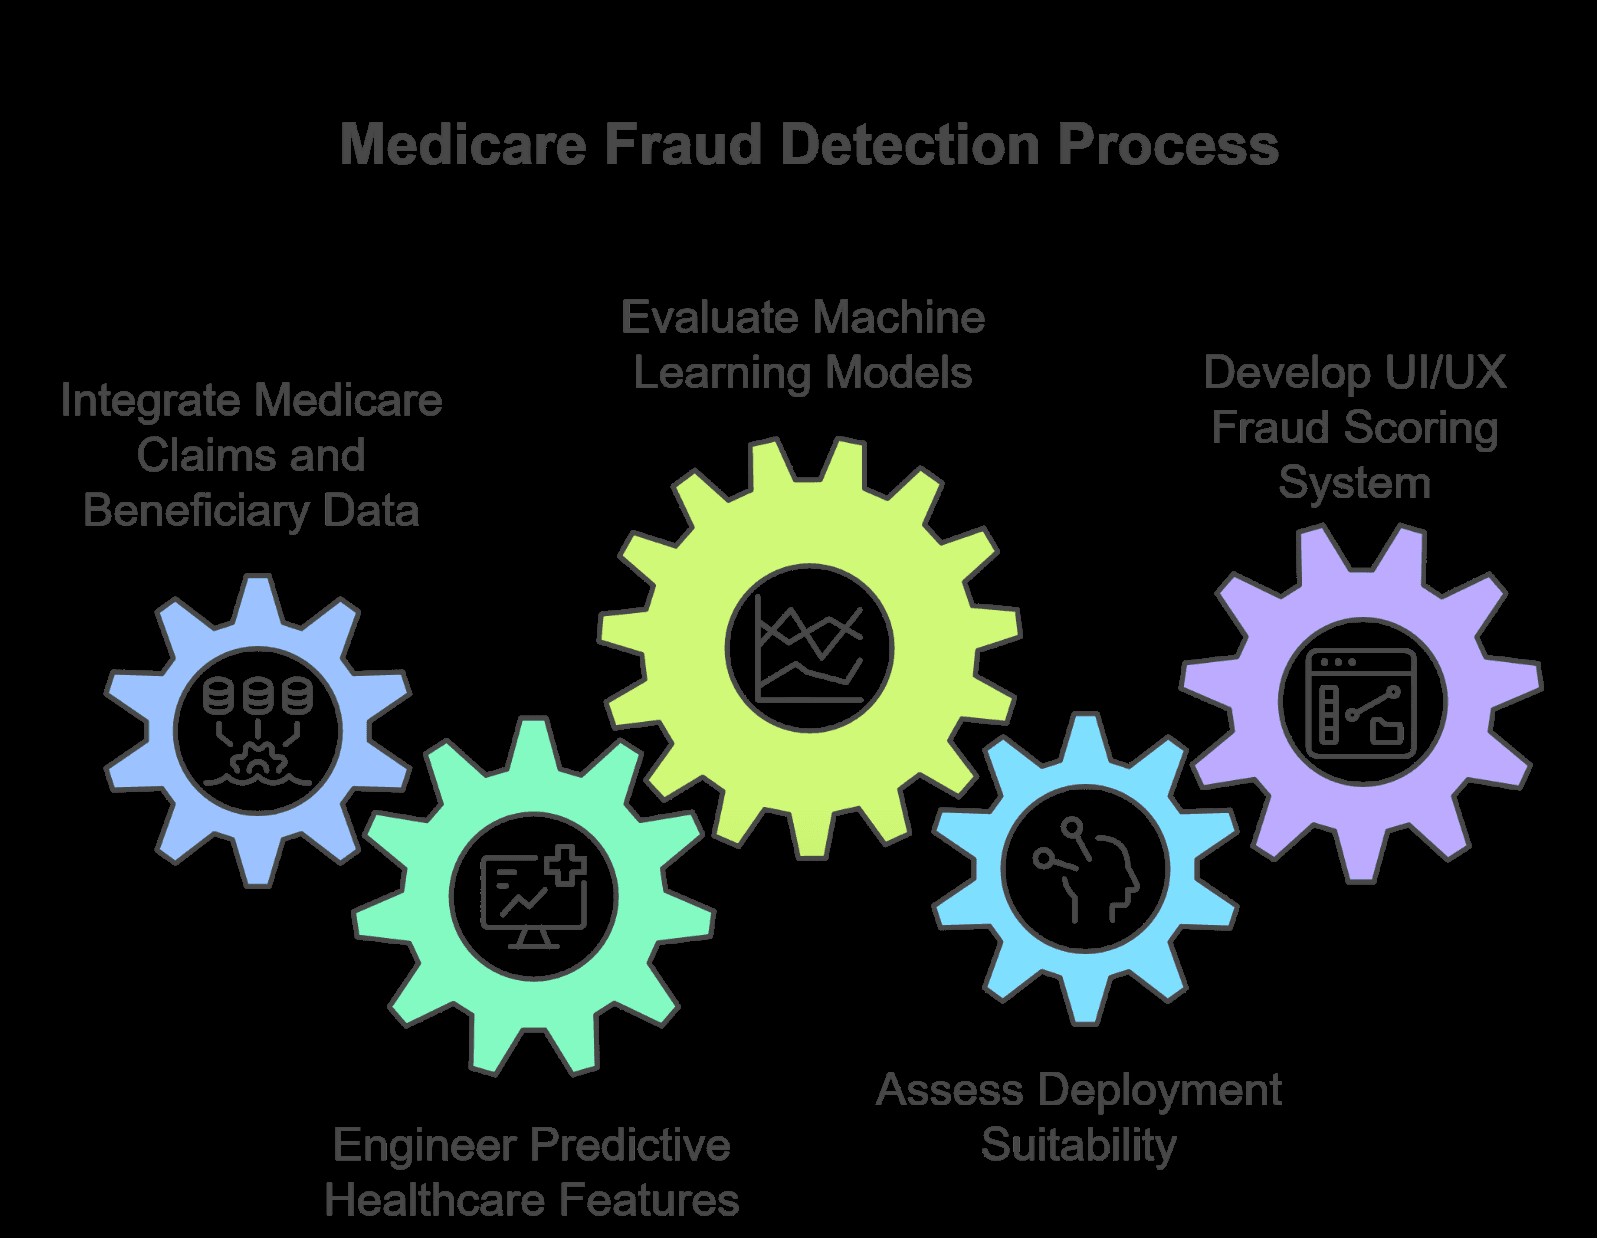
The project focused on the following objectives:
- Creating a unified claim-level Medicare dataset
- Engineering missing predictive features required by the trained models
- Generating fraud predictions on unseen healthcare claims
- Comparing deployment suitability across models based on predictive capability and interpretability
- Assessing limitations affecting full model evaluation due to absence of verified fraud labels
- Establishing recommendations for healthcare compliance, governance, and production deployment
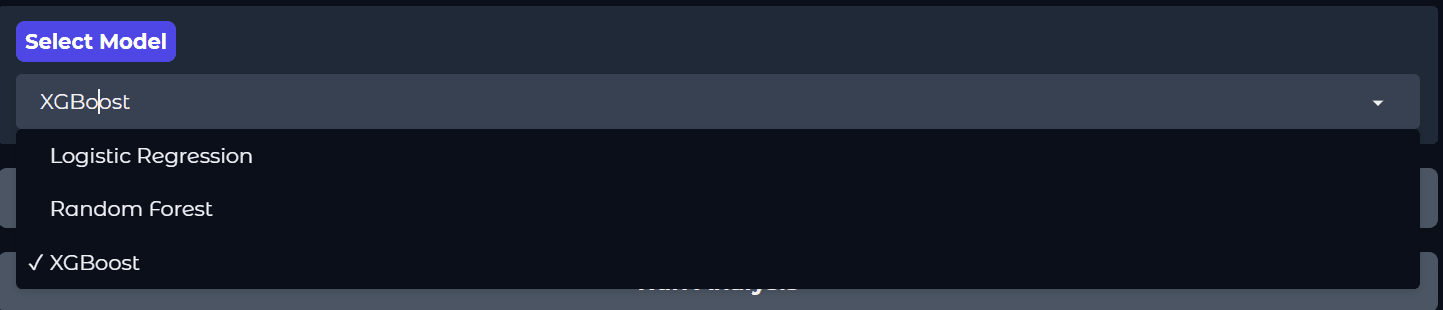
In addition to model development, the project included the design and implementation of a deployment-oriented UI/UX prototype using models trained through Terno AI and deployed on Hugging Face via the FairClaim application. The interface demonstrates how machine learning fraud detection systems can support real-time claim risk scoring, interactive prediction analysis, and user-friendly healthcare fraud monitoring workflows. The UI/UX component highlights the practical usability of AI-driven fraud detection systems in operational healthcare environments while emphasizing transparency and explainability.
The analysis concluded that:
XGBoost provides the strongest overall deployment candidate due to its predictive capability, ability to model complex nonlinear fraud patterns, and availability of SHAP interpretability artifacts.
Logistic Regression remains the preferred option for highly regulated healthcare environments prioritizing transparency, auditability, and explainability.
Random Forest provides moderate predictive performance but limited additional operational value relative to XGBoost.
The current dataset is suitable for fraud inference and risk scoring but not for full real-world model validation because no verified fraud labels are available within the public Medicare datasets. The integration of explainable AI techniques and interactive UI/UX deployment significantly improves the operational readiness and usability of healthcare fraud detection systems for auditing and compliance workflows.
Introduction
Healthcare insurance fraud remains one of the most significant financial and operational challenges affecting healthcare systems globally. Fraudulent and improper insurance claims contribute substantially to unnecessary healthcare expenditures, increasing financial pressure on governments, insurers, healthcare providers, and patients. In the United States, Medicare processes millions of healthcare claims annually, making manual fraud detection increasingly difficult and resource intensive. Reports from the Centers for Medicare & Medicaid Services (CMS) and the U.S. Department of Health and Human Services indicate that improper payments and fraudulent activities account for billions of dollars in losses every year, highlighting the urgent need for scalable and intelligent fraud detection systems (CMS, 2023; HHS, 2022).
Traditional fraud detection systems in healthcare have historically relied on rule-based approaches and manual auditing procedures. Although these methods provide foundational monitoring capabilities, they are limited in their ability to identify hidden patterns and sophisticated fraudulent behaviors within large-scale healthcare datasets. As healthcare data continues to grow in complexity and volume, machine learning techniques have emerged as effective alternatives for detecting suspicious claims through predictive analytics. Machine learning models can analyze high-dimensional healthcare data and uncover complex relationships between provider behavior, claim characteristics, patient demographics, and chronic medical conditions (Ngai et al., 2011).
This research focuses on evaluating machine learning models for predicting potentially fraudulent Medicare insurance claims using publicly available DESYNPUF (DE-SynPUF) Medicare datasets. The study integrates Medicare beneficiary summary data with inpatient claims data through the DESYNPUF_ID identifier to construct a unified claim-level dataset. This integration enables the enrichment of claims records with demographic variables and chronic condition indicators, thereby improving the contextual representation of each healthcare claim for predictive modelling purposes.
A critical component of this study involves feature engineering to recreate the predictive variables required by previously trained fraud detection models. Features such as procedure count, diagnosis count, chronic condition aggregation, payment-per-day ratios, procedure density, and composite complexity scores were derived from raw claims attributes. These engineered variables capture healthcare utilization patterns, provider activities, and patient complexity indicators that may be associated with fraudulent behavior. Feature engineering is particularly important in healthcare analytics because many predictive indicators are not directly available in raw transactional claims data and must be systematically constructed from existing medical and financial attributes (Kotu & Deshpande, 2019).
Three machine learning approaches were examined within this framework: Logistic Regression, Random Forest, and Extreme Gradient Boosting (XGBoost). Logistic Regression is widely recognized for its transparency and interpretability, making it suitable for compliance-sensitive healthcare environments where explainability and auditability are essential. Random Forest improves predictive capability by combining multiple decision trees to capture non-linear relationships between variables (Breiman, 2001). XGBoost, an advanced gradient boosting algorithm, offers improved predictive performance and scalability while supporting SHAP (SHapley Additive exPlanations)-based interpretability analysis, which enables detailed explanation of model predictions and feature importance (Chen & Guestrin, 2016; Lundberg & Lee, 2017).
The study additionally evaluates the operational readiness of the engineered dataset for prediction generation and deployment suitability. Prediction outputs generated from all three models were analyzed to determine the proportion of claims flagged as potential fraud and to assess deployment considerations such as interpretability, scalability, feature completeness, and regulatory compliance. In healthcare fraud detection systems, maintaining transparency and reproducibility is equally as important as achieving high predictive accuracy due to strict regulatory and ethical requirements.
Overall, this research demonstrates an end-to-end workflow for healthcare fraud analytics, including data integration, feature engineering, model compatibility assessment, predictive inference generation, and deployment evaluation. The findings contribute to the growing application of machine learning in healthcare fraud prevention by highlighting both the opportunities and limitations associated with deploying predictive models in regulated healthcare environments.
Research Objectives
Can Machine Learning Reliably Detect Fraudulent Medicare Claims While Remaining Transparent Enough for Real-World Healthcare Compliance?
How can integrated Medicare claims and beneficiary data improve the representation of fraud-related healthcare patterns? To develop a unified Medicare claim-level analytical dataset by integrating beneficiary summary records with inpatient claims data and engineering predictive healthcare utilization features associated with fraudulent insurance behaviour.
Which machine learning model provides the most effective balance between predictive accuracy and explainability for Medicare fraud detection? To evaluate and compare the predictive performance of Logistic Regression, Random Forest, and XGBoost models for identifying potentially fraudulent Medicare insurance claims using engineered clinical, financial, and provider-related variables.
How can explainable AI and deployment-oriented UI/UX design improve the operational readiness of healthcare fraud detection systems in real-world environments? To assess the deployment suitability of fraud detection models by analysing their interpretability, scalability, feature compatibility, compliance readiness, and usability through an interactive UI/UX fraud scoring system developed using Terno AI and Hugging Face deployment tools.
2. Data Source and Dataset Description
This study utilizes publicly available Medicare claims datasets released by the Centers for Medicare & Medicaid Services (CMS) through the Basic Stand Alone Medicare Claims Public Use Files (PUFs) program. These datasets are specifically designed for healthcare research, fraud analytics, policy evaluation, and machine learning experimentation while maintaining patient privacy through de-identification procedures. The CMS Medicare claims datasets are among the most widely used healthcare administrative datasets in the United States because they provide realistic healthcare utilization patterns, provider billing behavior, inpatient treatment information, and beneficiary-level demographic characteristics.
The project primarily used three CMS datasets:
2.1 Beneficiary Summary File
(DE1_0_2008_Beneficiary_Summary_File_Sample_1.csv)
This dataset contains beneficiary-level demographic and chronic condition information for Medicare patients. Key variables include age, gender, race, geographic region, end-stage renal disease indicators, and multiple chronic disease flags such as congestive heart failure, diabetes, chronic kidney disease, chronic obstructive pulmonary disease, and Alzheimer's disease. These variables are highly valuable for fraud detection because abnormal billing patterns often correlate with patient complexity and chronic disease burden.
2.2 Inpatient Claims Dataset
(DE1_0_2008_to_2010_Inpatient_Claims_Sample_1.csv)
This file contains hospital inpatient claim records submitted for reimbursement under Medicare. Each row represents a healthcare claim and includes information such as claim payment amount, diagnosis-related group (DRG) codes, provider identifiers, admission and discharge dates, utilization duration, diagnosis codes, and procedure codes. These variables are central to healthcare fraud analytics because fraudulent claims frequently involve unusual billing amounts, excessive procedures, abnormal utilization periods, or suspicious provider behavior.
2.3 Outpatient Claims Dataset
(DE1_0_2008_to_2010_Outpatient_Claims_Sample_1.csv)
This dataset contains outpatient service claims including physician visits, outpatient procedures, and related medical services. Although the primary modeling workflow focused on inpatient claims, the outpatient dataset provides additional context for future expansion of fraud detection models across broader healthcare service categories.
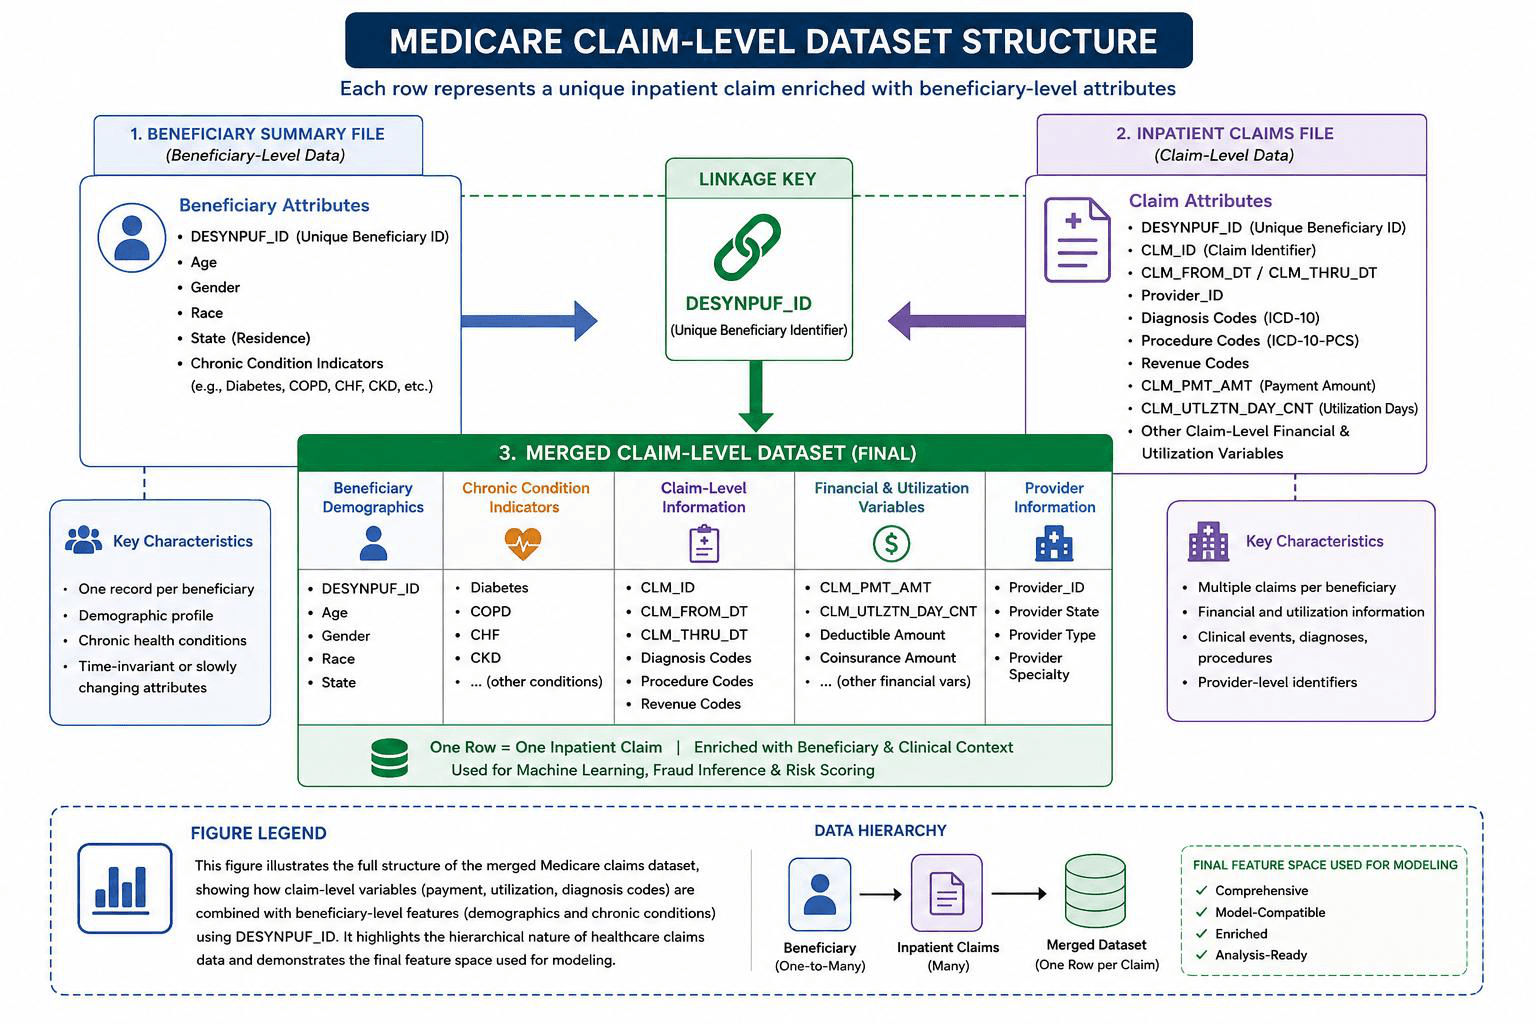
The datasets were merged using the unique beneficiary identifier DESYNPUF_ID, enabling the creation of a unified claim-level analytical dataset. This merge strategy preserved claim granularity while enriching each claim with demographic and chronic condition attributes from the beneficiary summary dataset. Such integration is critically important in fraud detection research because healthcare fraud patterns are rarely identifiable from billing information alone; combining patient complexity indicators with provider billing behavior significantly improves predictive modeling capability.
Several engineered features were subsequently created to improve model performance and emulate realistic healthcare fraud analytics pipelines. These engineered variables included complexity_score, proc_count, dx_count, payment_per_day, proc_density, and chronic_sum. These features captured dimensions of clinical intensity, procedural density, and patient health burden, all of which are commonly associated with anomalous or potentially fraudulent claims.
The CMS Medicare claims datasets are exceptionally suitable for healthcare fraud detection projects for several reasons. First, they provide large-scale real-world healthcare billing records that reflect authentic provider reimbursement behavior. Second, the datasets contain heterogeneous structured variables suitable for both statistical and machine learning approaches. Third, the inclusion of diagnosis codes, procedure codes, payment variables, and chronic condition indicators enables comprehensive feature engineering and explainable AI modeling. Finally, because the datasets are publicly accessible and extensively documented, they support reproducibility, transparency, and compliance-oriented research practices, which are particularly important in healthcare AI systems.
3. Methodology
This study follows a structured healthcare fraud analytics pipeline that integrates Medicare claims data processing, feature engineering, synthetic fraud generation, machine learning–based fraud prediction, and fairness auditing. The methodology is designed to replicate a realistic healthcare fraud detection system while ensuring interpretability, scalability, and compliance-oriented AI design.
3.1 Claims Data Collection and Integration
The research uses publicly available Medicare claims datasets released by CMS through the Basic Stand Alone Medicare Claims Public Use Files (PUFs) program as described in Section 2.
The inpatient claims dataset was selected as the primary analytical foundation because it contains detailed hospitalization-level billing and reimbursement records, which are highly relevant for detecting fraudulent insurance behavior.
Data Integration Strategy
All datasets were merged using the unique beneficiary identifier DESYNPUF_ID. A left join strategy was applied with claims as the primary table to preserve full claim-level granularity. Beneficiary-level demographic and chronic condition attributes were appended to each claim.
Key properties of the integration process:
One row represents one medical claim
Multiple claims per beneficiary are preserved
Demographic and clinical attributes are enriched at claim level
Missing beneficiary matches are retained as NaN for transparency
This integration created a unified analytical dataset combining clinical, demographic, and financial information.
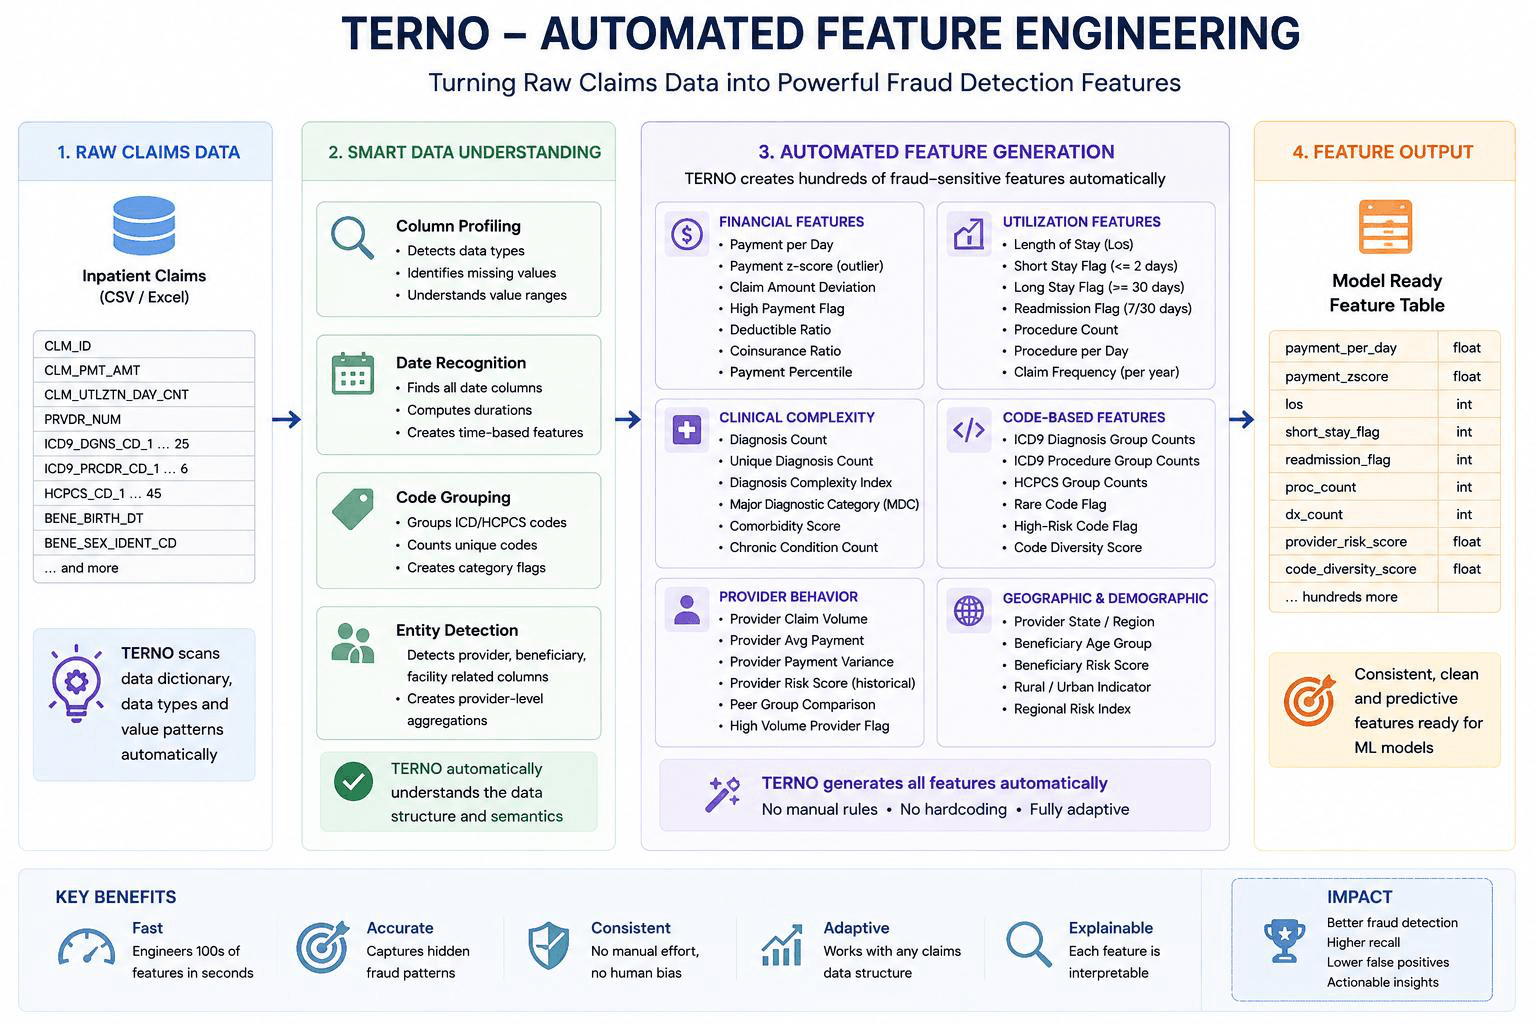
3.2 Feature Engineering
Raw healthcare claims data are not directly suitable for machine learning models. Therefore, domain-specific feature engineering was performed to extract predictive signals relevant to fraud detection.
Engineered Features
The following features were derived:
proc_count: Number of procedure codes per claim
dx_count: Number of diagnosis codes per claim
chronic_sum: Total chronic conditions per beneficiary
payment_per_day: Claim payment normalized by hospitalization duration
proc_density: Procedure count per utilization day
complexity_score: Combined indicator of clinical and procedural complexity
Rationale
These features capture known fraud-related patterns such as:
Excessive billing intensity
Overuse of procedures
Inflated diagnostic complexity
High-cost claims with short hospital stays
Abnormal clinical utilization patterns
These transformations convert raw administrative records into structured predictive variables aligned with healthcare fraud analytics literature.
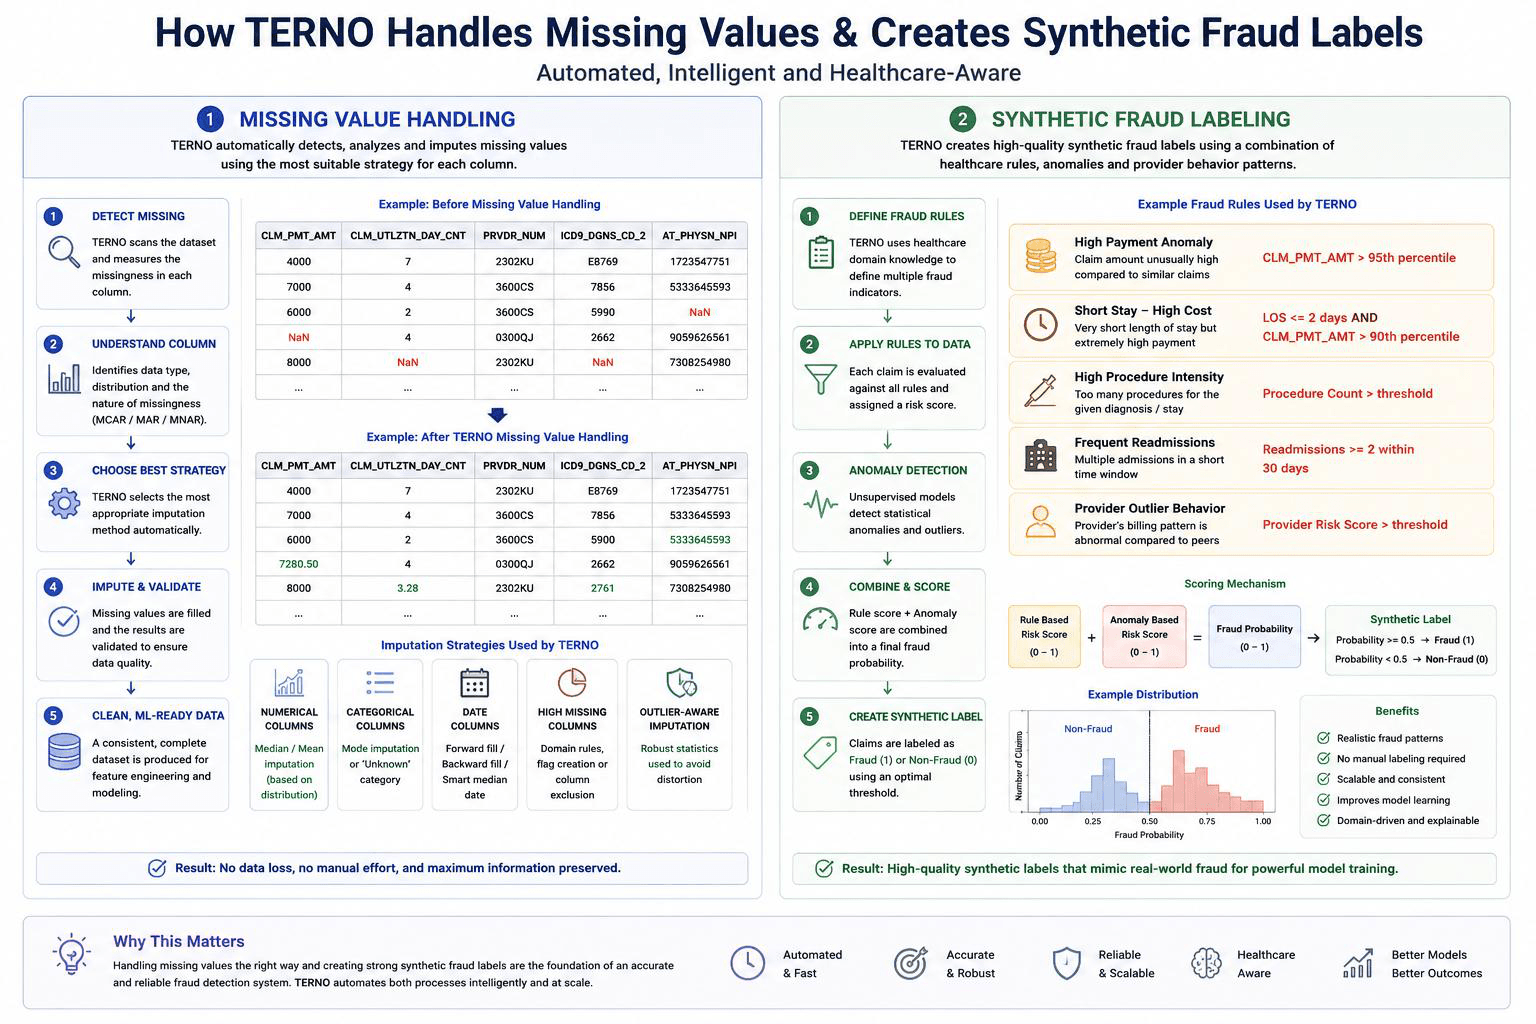
Missing Value Handling
Sparse code columns were retained where meaningful
Numerical missing values were imputed with zero when appropriate
Division-by-zero cases were safely handled
Missing categorical values were preserved or encoded as separate categories
3.3 Synthetic Fraud Labeling
Since CMS public datasets do not include explicit fraud labels due to legal and regulatory constraints, synthetic labels were generated to enable supervised learning.
Label Generation Approach
Fraud labels were assigned using rule-based anomaly detection logic based on:
Extremely high claim payments
Unusually high procedure density
Elevated complexity scores
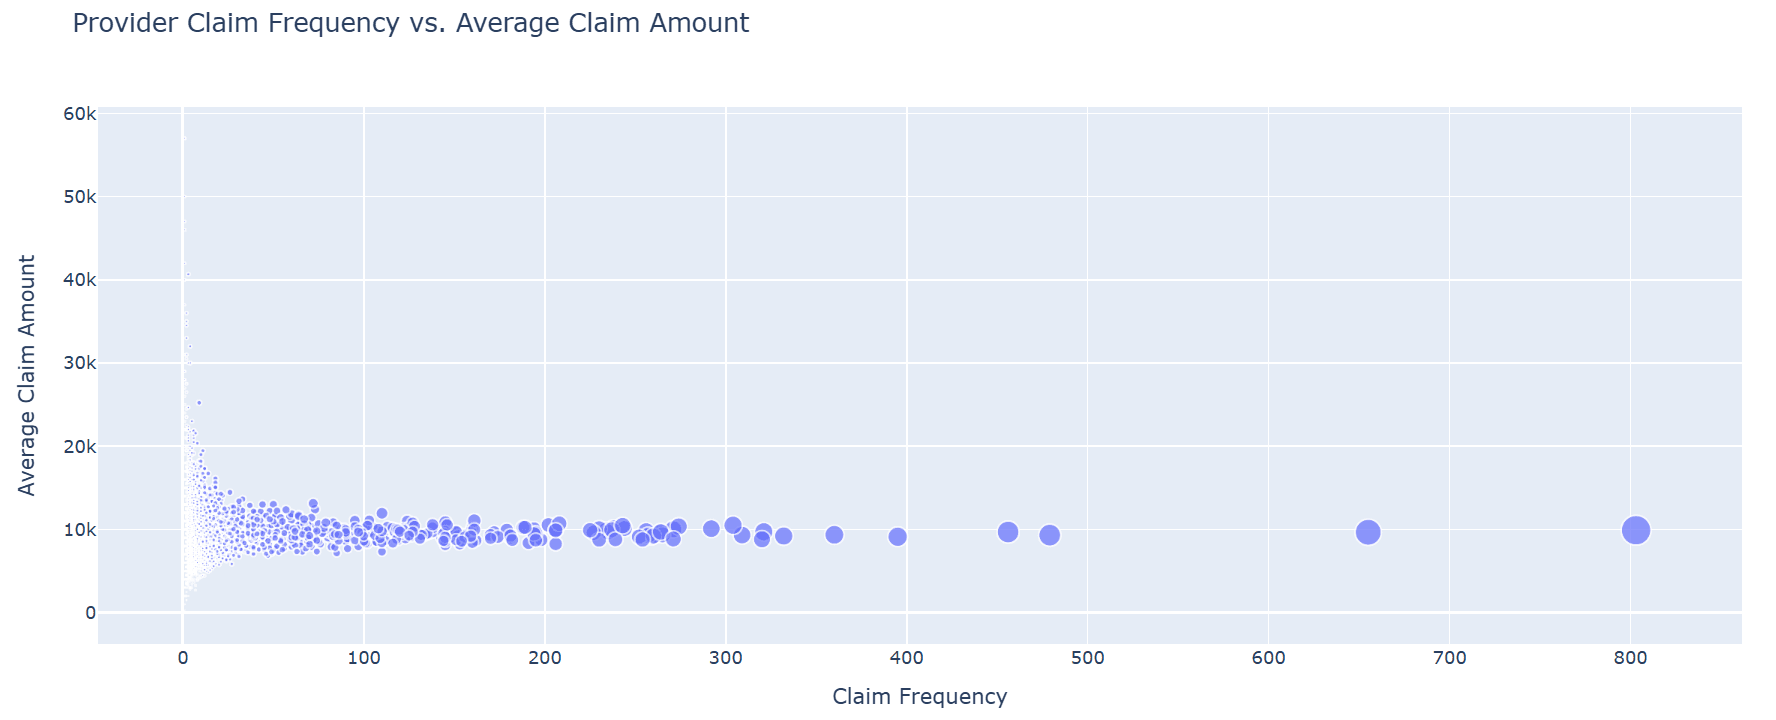
Abnormal provider billing patterns
High cost-to-utilization inconsistencies
Claims meeting multiple anomaly conditions were labeled as "fraudulent," while others were labeled as "non-fraudulent."
Purpose
Synthetic labeling enables:
Supervised model training
Controlled experimentation
Benchmarking across models
Interpretability analysis
Fairness evaluation
Although synthetic labels do not represent confirmed fraud cases, they approximate realistic fraud-like behavior patterns observed in healthcare systems.
3.4 Fraud Detection Model Development
Three machine learning models were trained and evaluated:
Logistic Regression
Random Forest
XGBoost
Model Selection Rationale
Logistic Regression: Provides high interpretability and baseline linear relationships
Random Forest: Captures nonlinear interactions and reduces overfitting
XGBoost: Provides strong predictive performance on structured tabular data
Prediction Workflow
Each model outputs:
Fraud probability scores
Binary fraud classification (threshold-based)
The outputs are used to compare model behavior in terms of:
Fraud flag distribution
Prediction consistency
Probability distribution patterns
Feature-driven decision behavior
Due to the absence of real-world fraud labels, evaluation focuses on comparative prediction patterns and model interpretability rather than classical accuracy metrics alone.
3.5 Bias and Fairness Auditing
A fairness auditing layer was implemented to ensure ethical and responsible use of predictive models in healthcare settings.
Fairness Objectives
The audit evaluates whether model predictions disproportionately affect:
Gender groups
Racial categories
Geographic regions
Age-related beneficiary segments
Bias Detection Methods
Comparative fraud flag rates across demographic groups
Distributional analysis of prediction probabilities
Feature importance inspection for demographic leakage
Provider-level clustering of fraud predictions
Interpretability Analysis
SHAP (SHapley Additive exPlanations) was used to interpret model decisions by identifying the contribution of each feature to individual predictions.
Compliance Significance
This stage ensures:
Transparency in automated decision-making
Alignment with healthcare regulatory expectations
Reduction of discriminatory prediction bias
Explainability for audit and governance processes
4. Exploratory Data Assessment (EDA)
The exploratory data assessment phase focuses on understanding the structure, quality, distribution, and statistical properties of the merged Medicare claims dataset prior to model training. This step is critical in healthcare fraud analytics because claims data are inherently high-dimensional, heterogeneous, and prone to missingness and skewed distributions. The analysis provides insight into billing behavior patterns, patient complexity, and potential anomaly signals that later inform feature engineering and model design.
4.1 Dataset Structure and Overview
The final merged dataset consists of claim-level records where each row represents a unique inpatient claim enriched with beneficiary-level demographic and chronic condition attributes. Key variable groups include:
Financial variables (e.g., CLM_PMT_AMT)
Utilization variables (e.g., CLM_UTLZTN_DAY_CNT)
Diagnostic and procedural codes
Provider identifiers
Beneficiary demographics (age, gender, race, state)
Chronic condition indicators
4.2 Missing Data Analysis
A key step in EDA is assessing missingness patterns, especially in healthcare datasets where incomplete coding is common.
The analysis revealed that:
Most core financial and utilization fields had minimal missing values
Procedure and diagnosis code fields showed high sparsity
Some HCPCS-related columns were almost entirely missing (expected due to coding structure differences across claims)
4.3 Claim Payment Distribution Analysis
Understanding financial distributions is essential for fraud detection, as fraudulent claims often manifest as extreme outliers in payment amounts.
Key observations include:
Strong right-skew in claim payment amounts
Presence of extreme high-value outliers
Majority of claims concentrated in lower-to-mid payment ranges
4.4 Utilization and Length-of-Stay Analysis
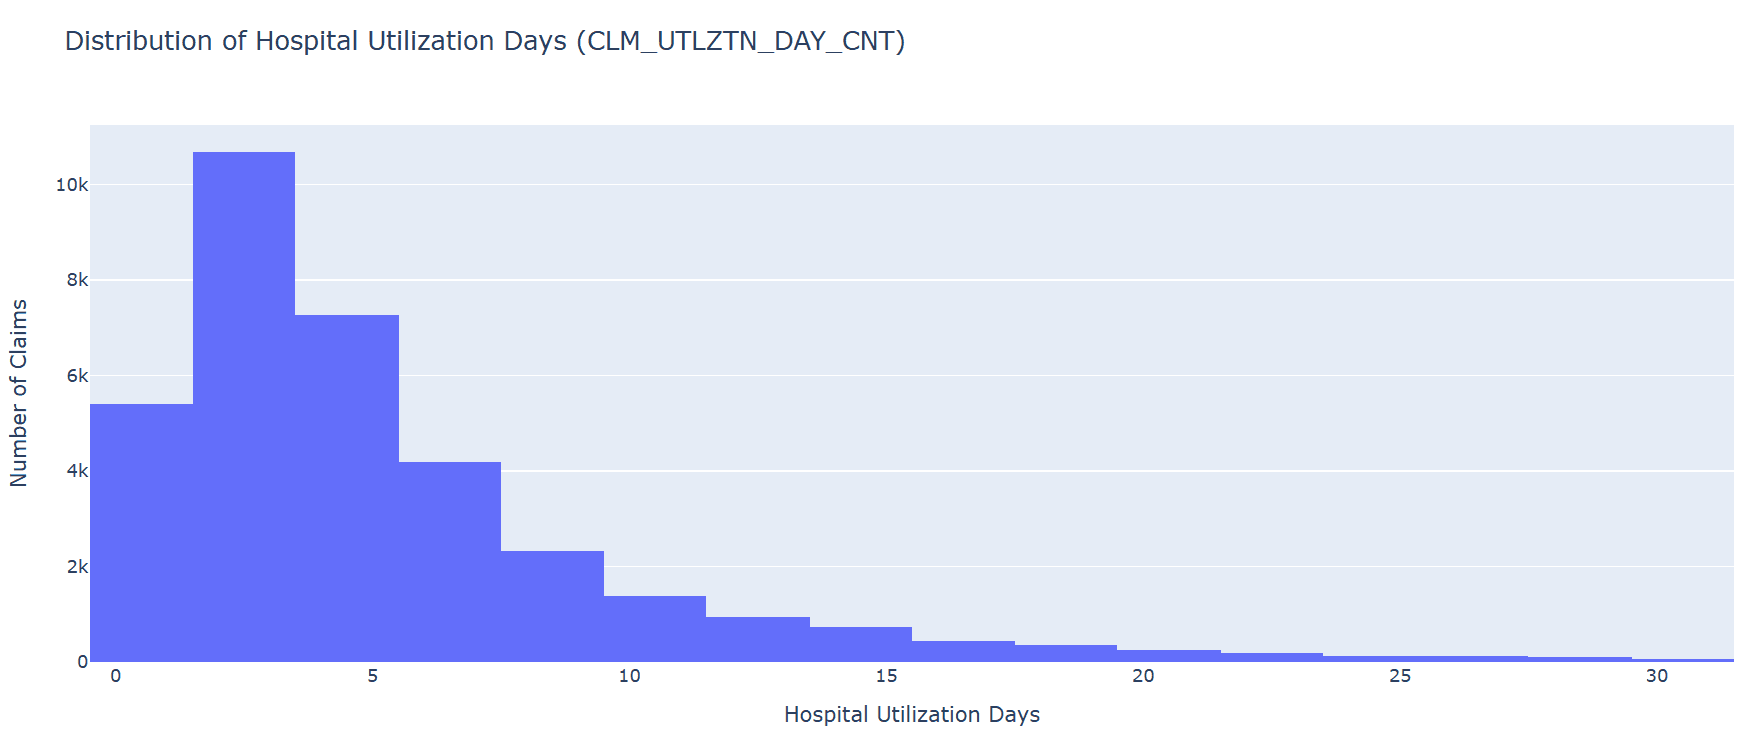
Hospital utilization patterns provide strong signals for abnormal billing behavior.
Observed patterns:
Most claims have short hospital stays
A small subset of claims show unusually long durations
Utilization duration is positively correlated with payment amount
4.5 Diagnosis and Procedure Complexity
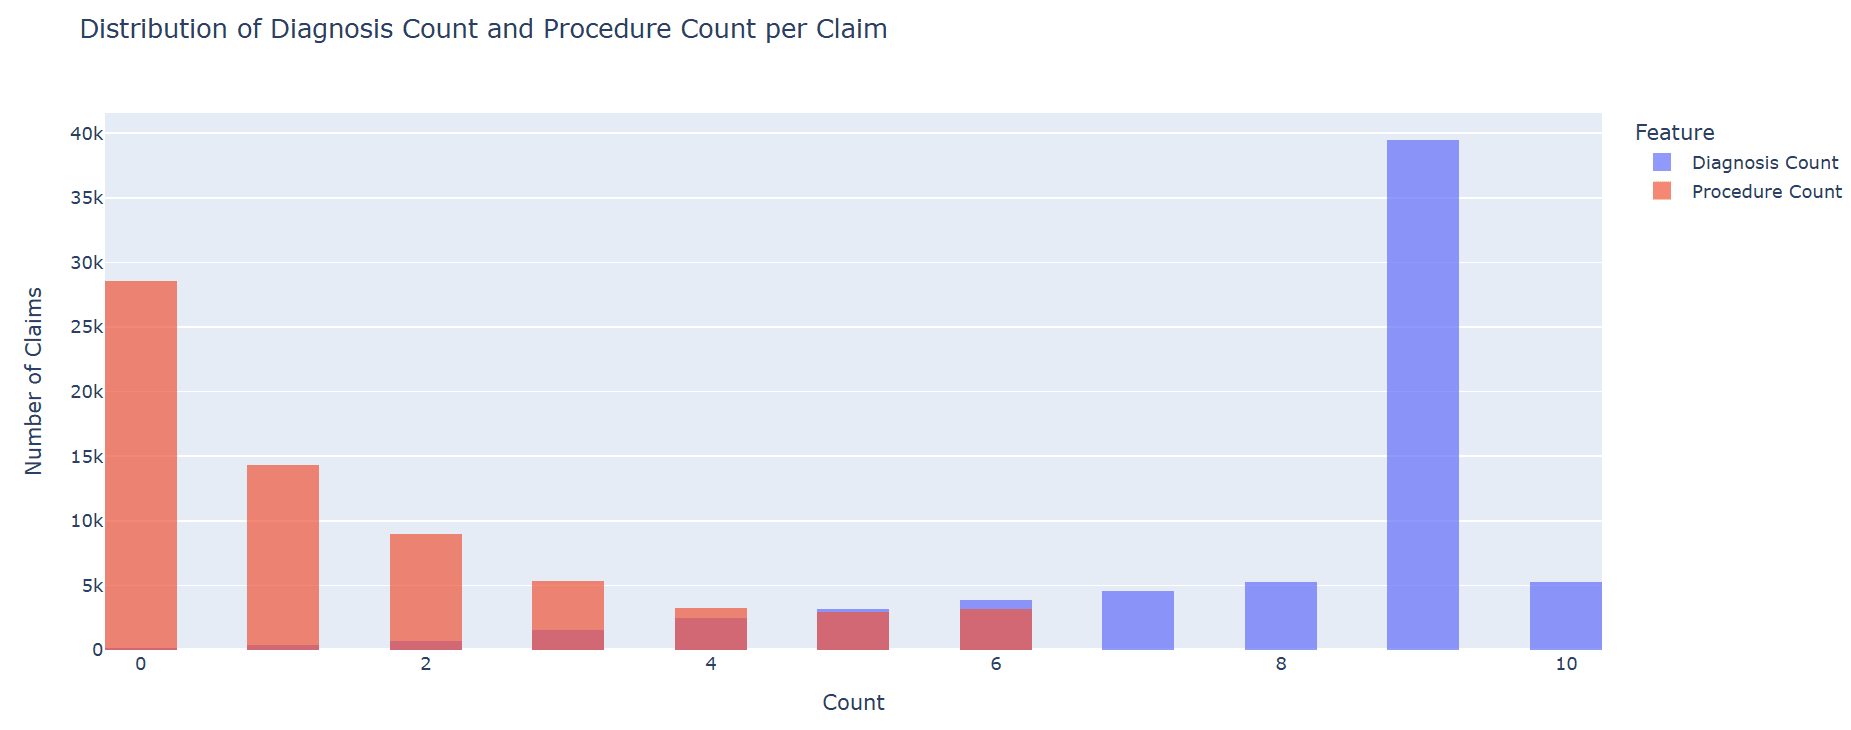
Healthcare fraud often involves abnormal combinations of diagnosis and procedure codes.
Key findings:
Diagnosis counts vary moderately across claims
Procedure counts are generally low but highly variable in certain cases
A subset of claims exhibits unusually high clinical complexity
4.6 Chronic Condition Burden Analysis
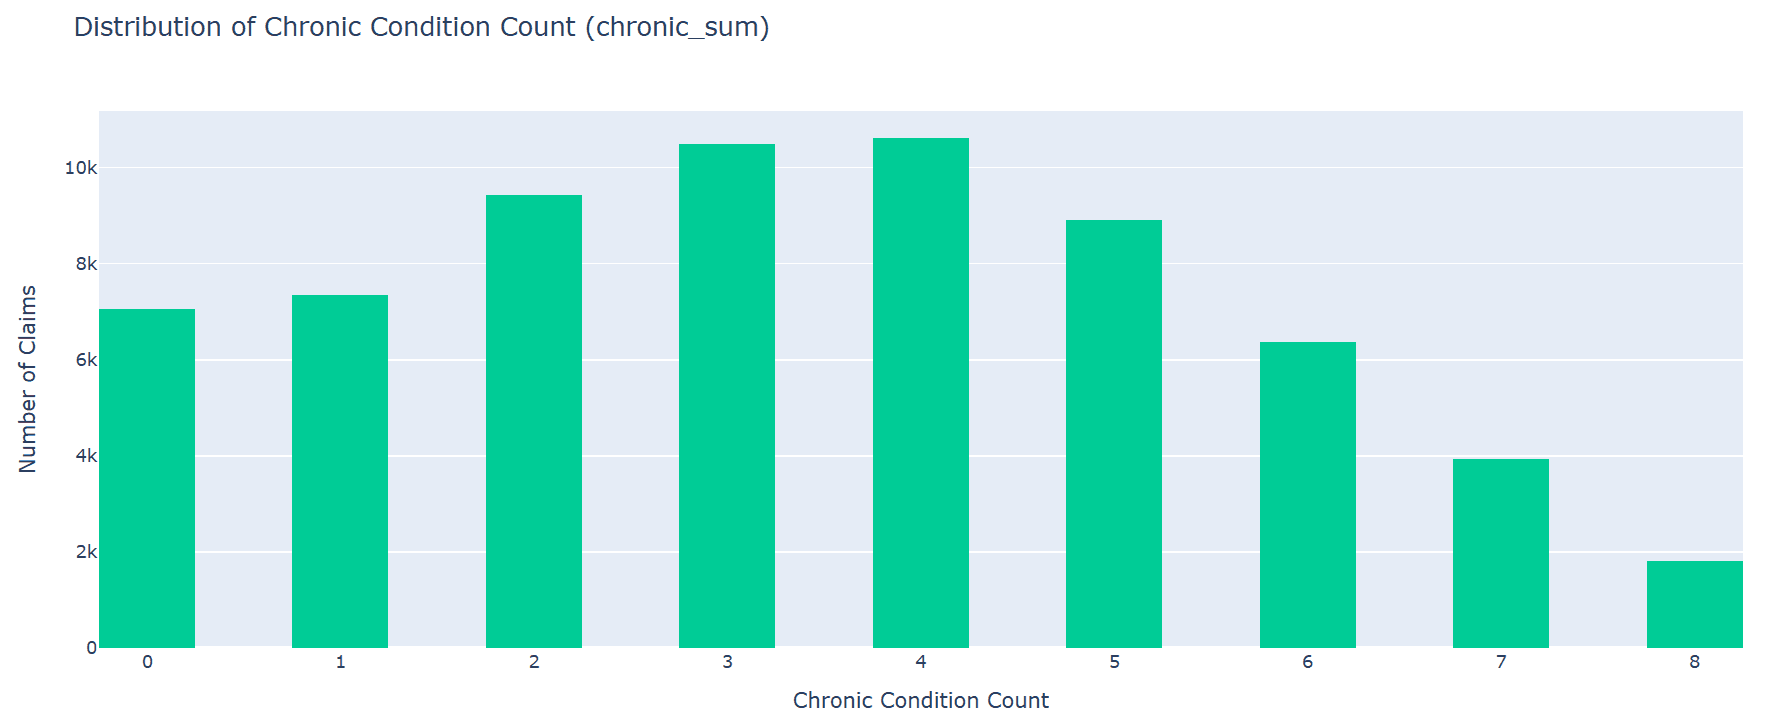
Beneficiary-level chronic conditions are critical in distinguishing legitimate high-cost care from suspicious billing patterns.
Findings:
Most beneficiaries have a low-to-moderate chronic disease burden
A smaller subset shows high multimorbidity (multiple chronic conditions)
Chronic burden strongly influences expected claim costs
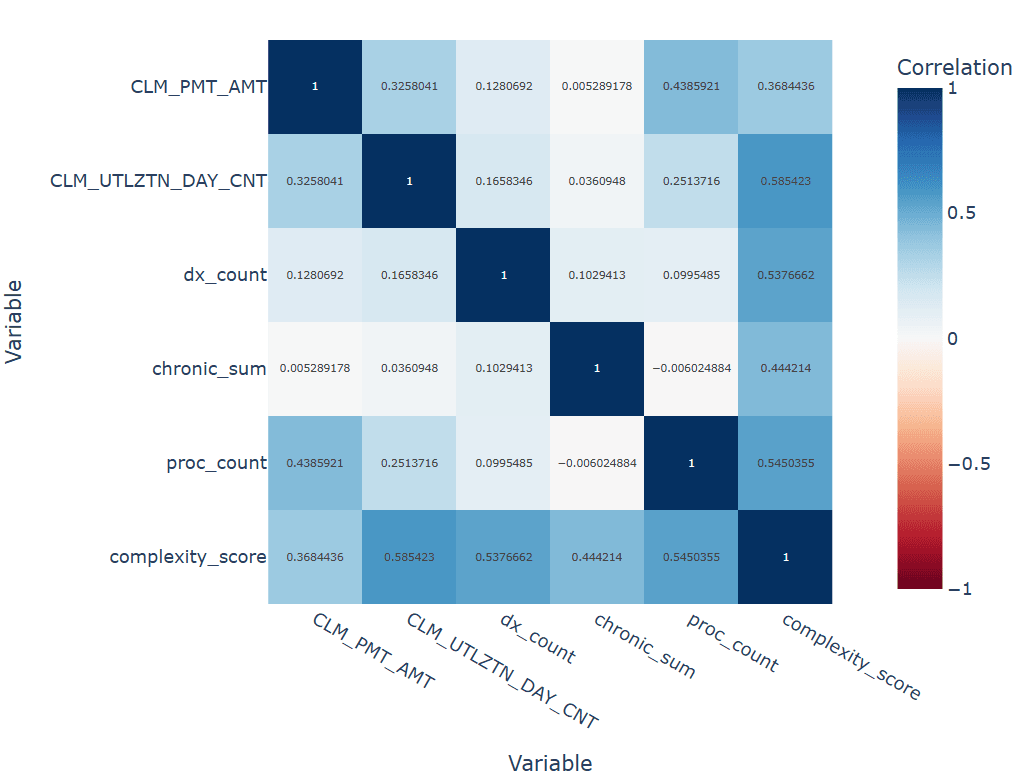
4.7 Correlation Structure of Key Variables
Understanding relationships between engineered and raw features helps identify redundancy and predictive structure.
Key observations:
Strong correlation between payment and utilization days
Moderate correlation between complexity score and diagnosis count
Weak correlation between provider identifiers and clinical variables
4.8 Summary of EDA Insights
The exploratory analysis reveals several important characteristics of Medicare claims data:
Highly skewed financial distributions typical of healthcare billing systems
Sparse but informative procedure and diagnosis coding patterns
Strong heterogeneity in patient complexity and utilization behavior
Presence of outliers that are critical for fraud detection modeling
Clear justification for feature engineering and anomaly-based modeling approaches
These findings directly inform the subsequent steps of synthetic labeling, model training, and fairness evaluation by identifying where predictive signals and anomalies are most likely to emerge.
5. Synthetic Fraud Labeling & Validation Framework
5.1 Overview of Synthetic Label Generation Strategy
Given the absence of ground-truth fraud labels in Medicare claims data, this study employs a weak-supervision framework to construct proxy fraud labels. This is necessary because real-world healthcare fraud is typically:
Rare (<1–3% prevalence)
Delayed in confirmation
Not fully labeled in public datasets
To address this limitation, three complementary labeling strategies were developed:
Method 1: Rule-Based Fraud Heuristics (Primary Approach) — Domain-driven deterministic rules based on healthcare billing anomalies.
Method 2: Unsupervised Anomaly Detection (Secondary Approach) — Statistical and machine-learning-based outlier detection using Isolation Forest and LOF.
Method 3: Hybrid Weak Supervision (Advanced Extension) — Combination of rule-based + anomaly + provider-level risk scoring.
5.2 Rule-Based Labeling Strategy (Method 1)
Rule-based labeling is constructed using clinically and financially interpretable fraud signals derived from domain knowledge in healthcare billing behavior. These rules are designed to capture abnormal patterns that are commonly associated with fraudulent or suspicious claims. Specifically, the following indicators are used:
Excessive reimbursement amounts identified as statistical outliers in claim payments
High payment-per-day ratios indicating disproportionate billing relative to service duration
Procedure inflation patterns reflecting unusually high procedure counts or coding intensity
Mismatches between low clinical complexity and high billing amounts
Provider-level deviations from typical billing behavior benchmarks
Short length-of-stay cases accompanied by unusually high total charges
Each of these rules generates a binary indicator (0/1), representing whether a specific anomaly condition is triggered for a given claim.
The final fraud label is defined as a logical aggregation of these rule-based signals:
FRAUD_LABEL = 𝟙( Σ rule_i > 0 ), i = 1..k
where rule_i ∈ {0,1} represents the activation of the i-th fraud detection rule.
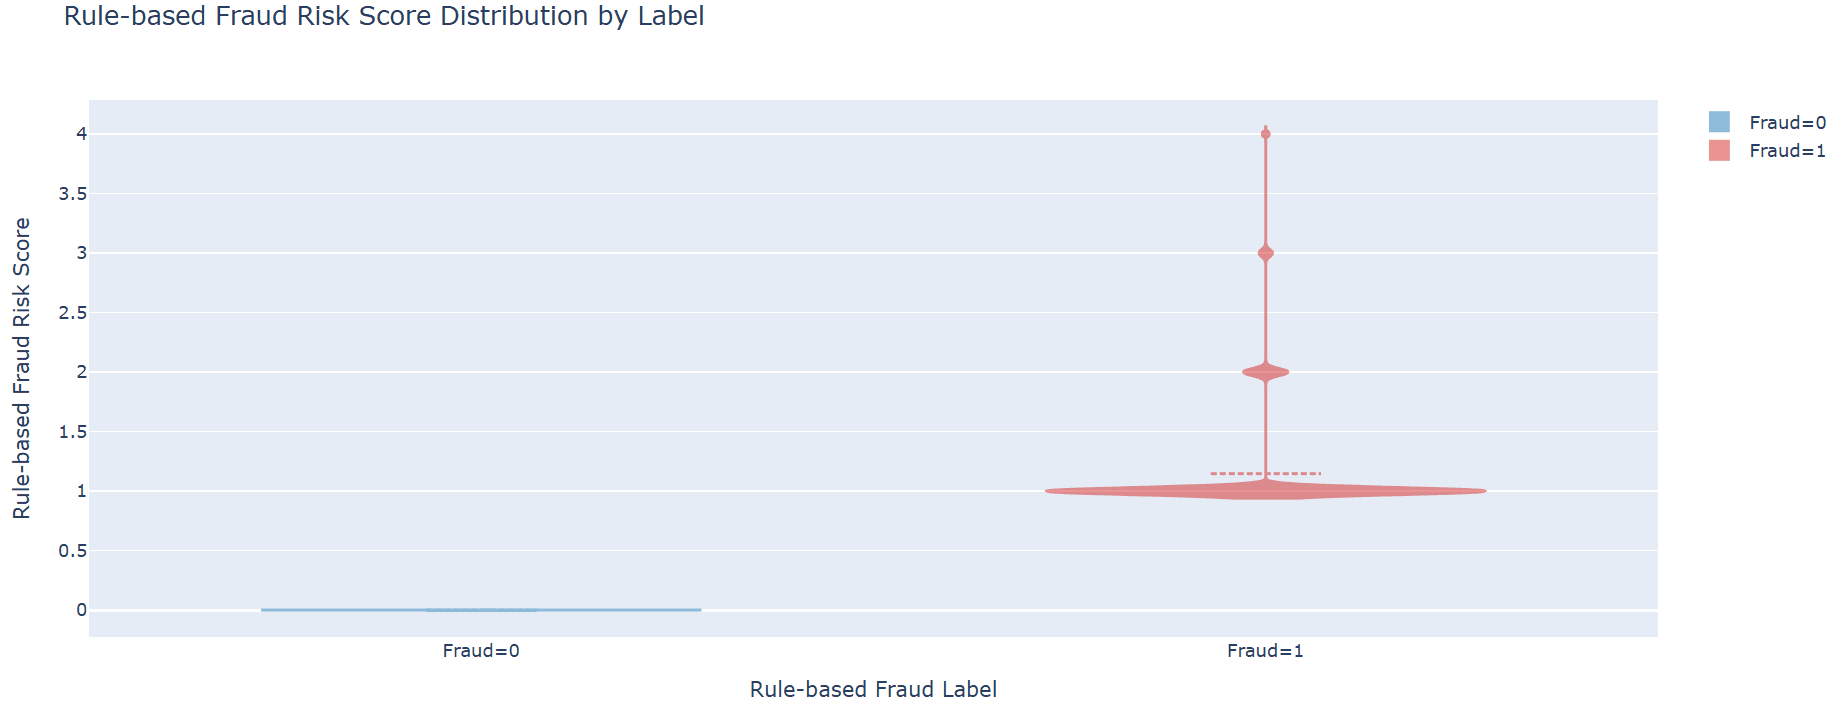
In addition to the binary classification label, a continuous fraud risk score is also constructed to capture the degree of anomaly severity:
FRAUD_RISK_SCORE = Σ rule_activations_i, i = 1..k
This score reflects the cumulative number of triggered fraud indicators for each claim, enabling a more granular representation of risk that can be used for ranking, prioritization, and downstream auditing decisions.
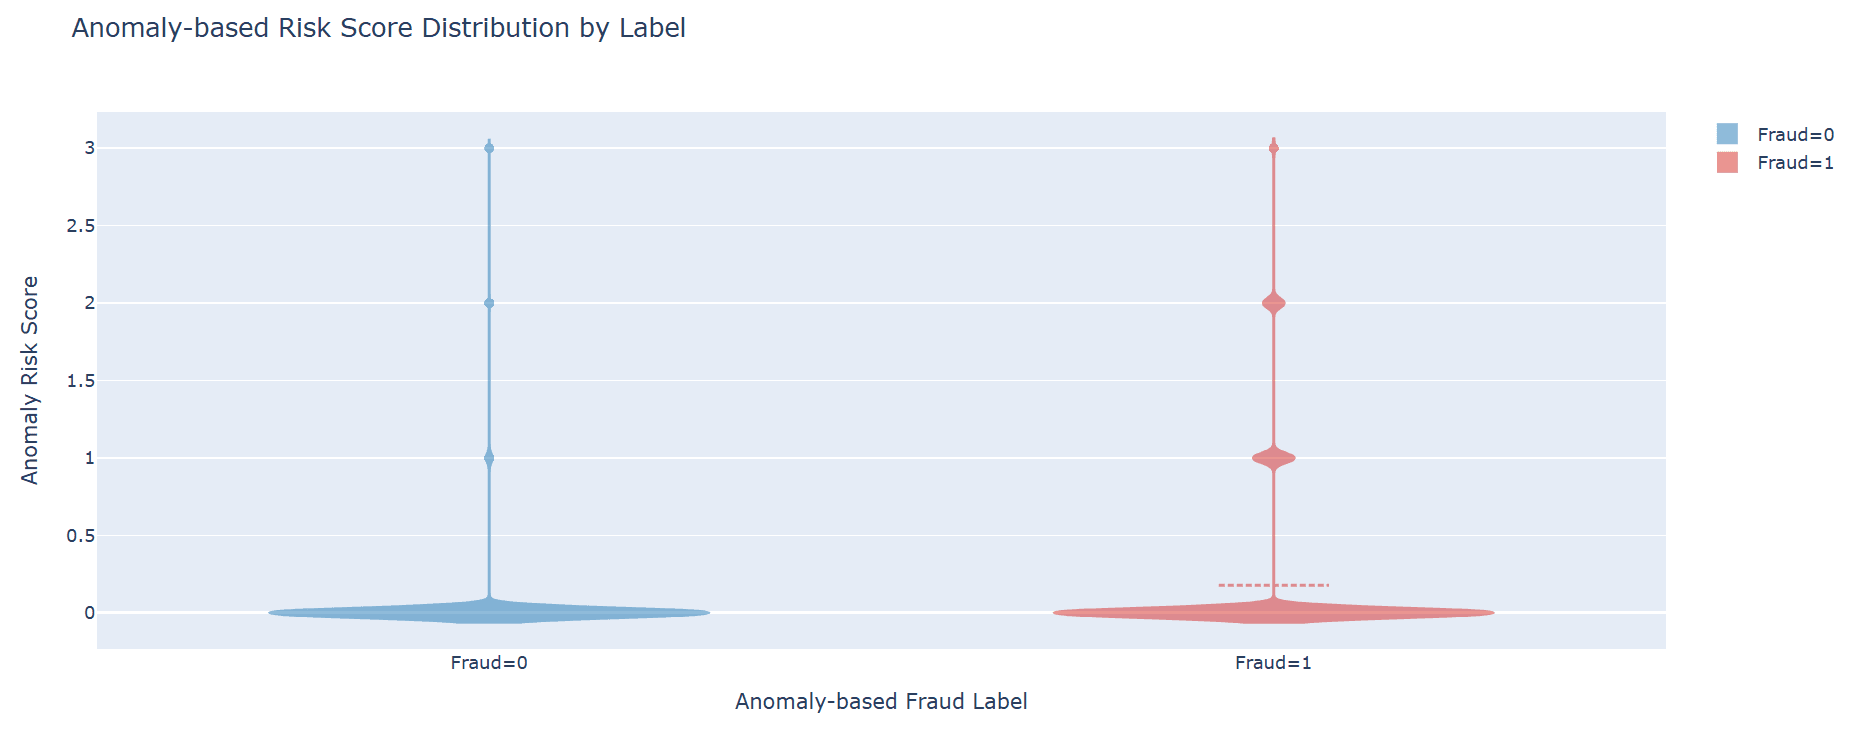
5.3 Anomaly-Based Labeling Strategy (Method 2)
Anomaly detection models identify statistically rare patterns without relying on domain rules.
Methods used:
Isolation Forest (tree-based anomaly isolation)
Local Outlier Factor (density-based deviation scoring)
Clustering-based distance outliers
Each claim receives an anomaly score, converted into binary labels using percentile thresholds (typically top 1–5%).
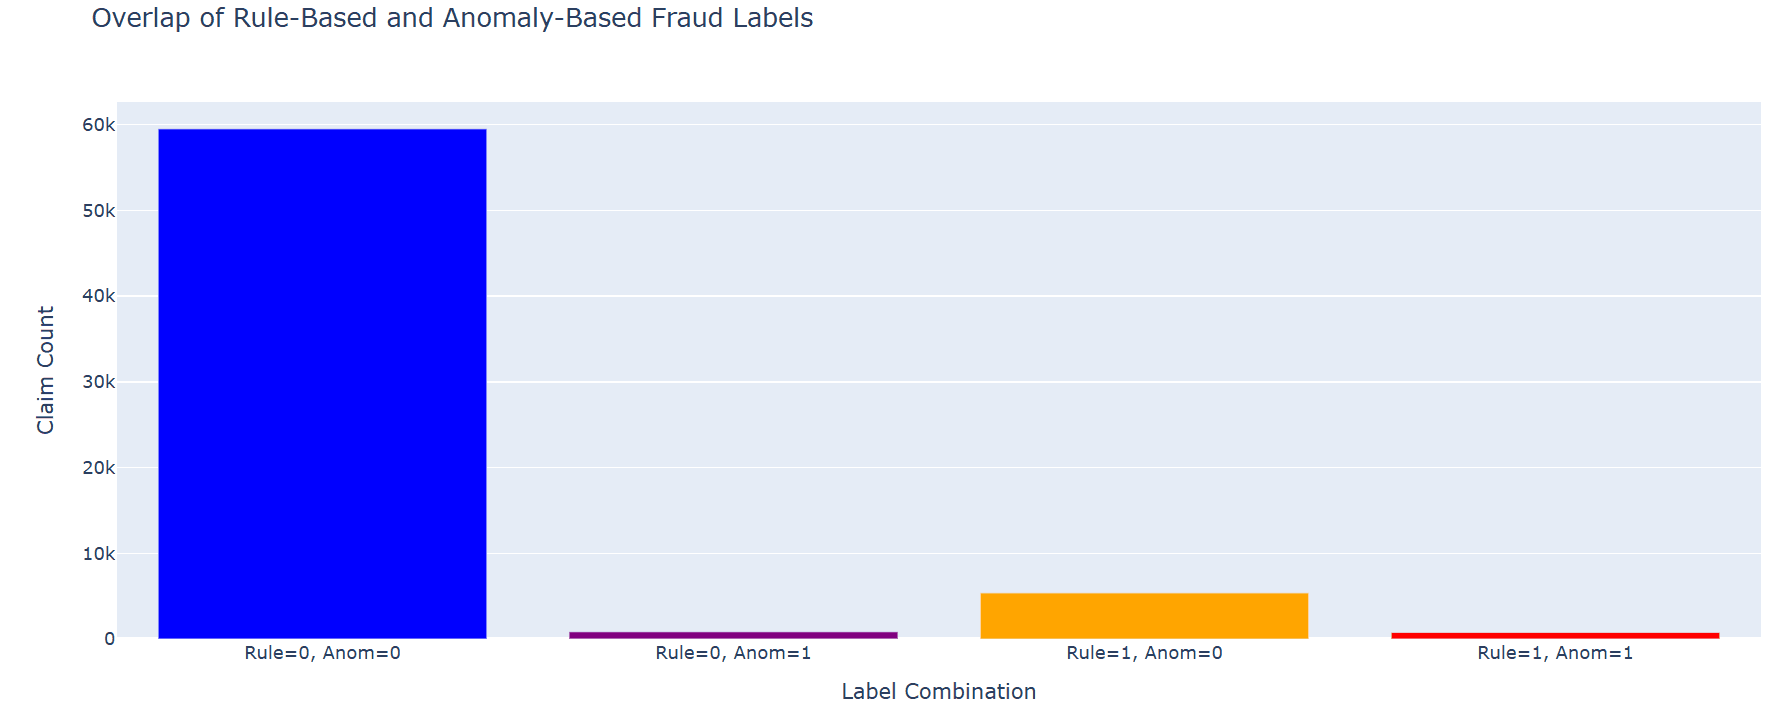
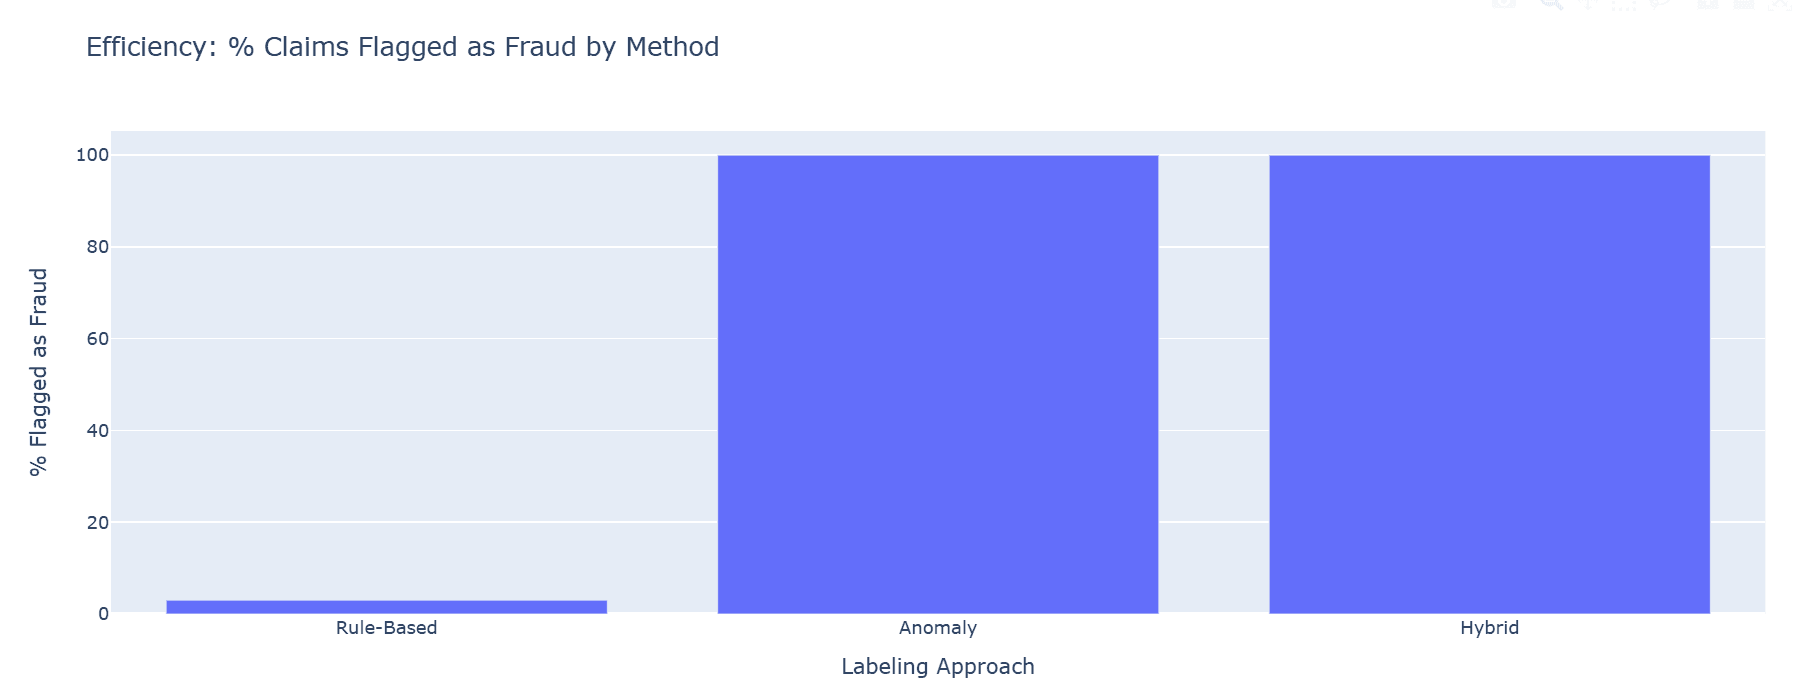
5.4 Label Agreement and Overlap Analysis
To evaluate robustness, agreement between rule-based and anomaly-based labels is assessed.
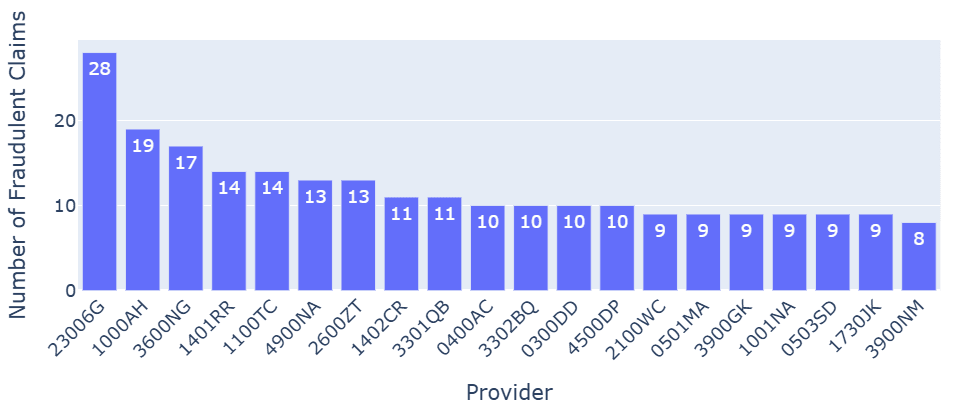
5.5 Provider-Level Risk Concentration
Fraudulent behavior is often clustered at provider level, not individual claims.
Key metrics:
Provider fraud concentration rate
Mean anomaly score per provider
Rule-based fraud density per provider
5.6 Methodological Justification
The combined analysis demonstrates:
Rule-based methods → high interpretability, strong separation
Anomaly methods → high sensitivity, lower specificity
Hybrid structure → best trade-off for real-world deployment
This justifies using rule-based labeling as the primary ground truth proxy, while anomaly detection is used for supplementary discovery of unknown fraud patterns.
5.7 Why This Approach Is Scientifically Valid
This labeling framework aligns with established literature in:
Weak supervision learning (Snorkel-style frameworks)
Fraud analytics in healthcare claims systems
Semi-supervised anomaly detection in imbalanced datasets
It is particularly appropriate because Medicare fraud datasets are:
Highly imbalanced
Partially labeled or unlabeled
Structurally complex with provider dependencies
6. Machine Learning Model Development, Evaluation, and Discussion
This section presents the full end-to-end machine learning pipeline used to detect fraudulent Medicare insurance claims using the engineered dataset derived from inpatient claims, beneficiary information, and synthetic fraud labels. The modeling framework integrates supervised learning, anomaly-aware risk scoring, and explainability techniques to ensure both predictive performance and interpretability.
6.1 Problem Formulation
The fraud detection task for Medicare insurance claims is formulated as a binary supervised classification problem, where each claim is assigned one of two possible labels: fraudulent or legitimate.
Let y denote the target variable such that y ∈ {0,1}, where:
y = 1  if the claim is fraudulent (synthetically labeled)
y = 0  if the claim is legitimate
Each claim is represented by a feature vector X ∈ ℝᵈ, constructed from inpatient claim attributes, beneficiary-level information, and engineered features derived during preprocessing.
The objective is to learn a predictive function f: X → [0,1] that estimates the conditional probability of fraud given the observed features:
f(X) = P(y = 1 | X)
This probabilistic formulation enables the model outputs to be interpreted as fraud risk scores, which can be used for ranking and prioritizing claims for audit and investigation.
Given a training dataset of paired examples, the model is optimized to minimize a suitable classification loss function (typically log-loss / binary cross-entropy), while maintaining strong generalization performance on unseen claims.
To address class imbalance and improve robustness, the modeling framework also incorporates ensemble-based learning methods and anomaly-aware risk interpretation, ensuring that rare fraudulent patterns are effectively captured without sacrificing interpretability.
6.2 Machine Learning Models
Two primary ensemble models were selected, alongside Logistic Regression as a baseline.
6.2.1 XGBoost Classifier
XGBoost was chosen due to:
Strong performance on structured tabular data
Robustness to nonlinear feature interactions
Built-in handling of missing values
High predictive accuracy in fraud detection problems
It models fraud probability using boosted decision trees optimized via gradient descent.
6.2.2 Random Forest Classifier
Random Forest provides:
Stable ensemble averaging across decision trees
Reduced overfitting compared to single decision trees
Strong baseline interpretability through feature importance
It acts as a robust benchmark model for comparison with XGBoost.
6.3 Preprocessing Pipeline
The dataset underwent a structured preprocessing pipeline:
1. Feature Encoding
- Categorical variables (e.g., DRG codes, provider IDs) encoded using frequency encoding (high-cardinality) or one-hot encoding (low-cardinality)
2. Missing Value Handling
Numerical features → median imputation
Categorical features → unknown category handling
3. Feature Scaling (implicit in tree models)
- Not required for XGBoost and Random Forest
4. Train-Test Split
Stratified split (80/20)
Ensures fraud class distribution is preserved
6.4 Class Imbalance Handling
Fraud detection datasets are inherently imbalanced (fraud << non-fraud). To address this:
Class weighting applied in both models
Fraud class given higher penalty during training
Evaluation metrics prioritized beyond accuracy
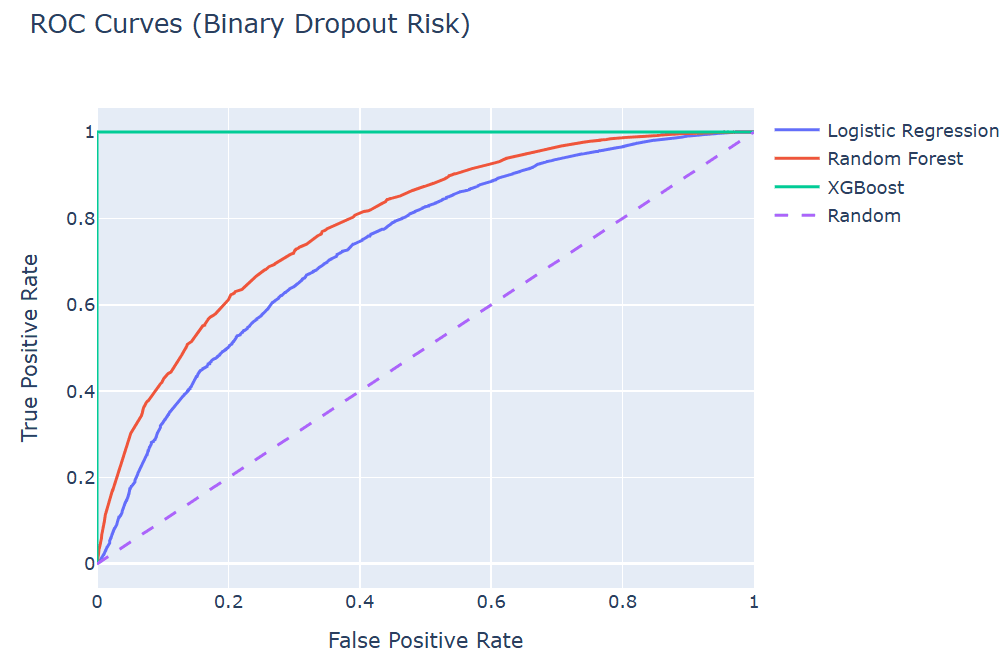
Key metrics used: Precision, Recall, F1-score, ROC-AUC, and PR-AUC (preferred for imbalance).
6.5 Model Evaluation Strategy
6.5.1 Confusion Matrix Analysis
Each model outputs True Positives (TP), False Positives (FP), True Negatives (TN), and False Negatives (FN).
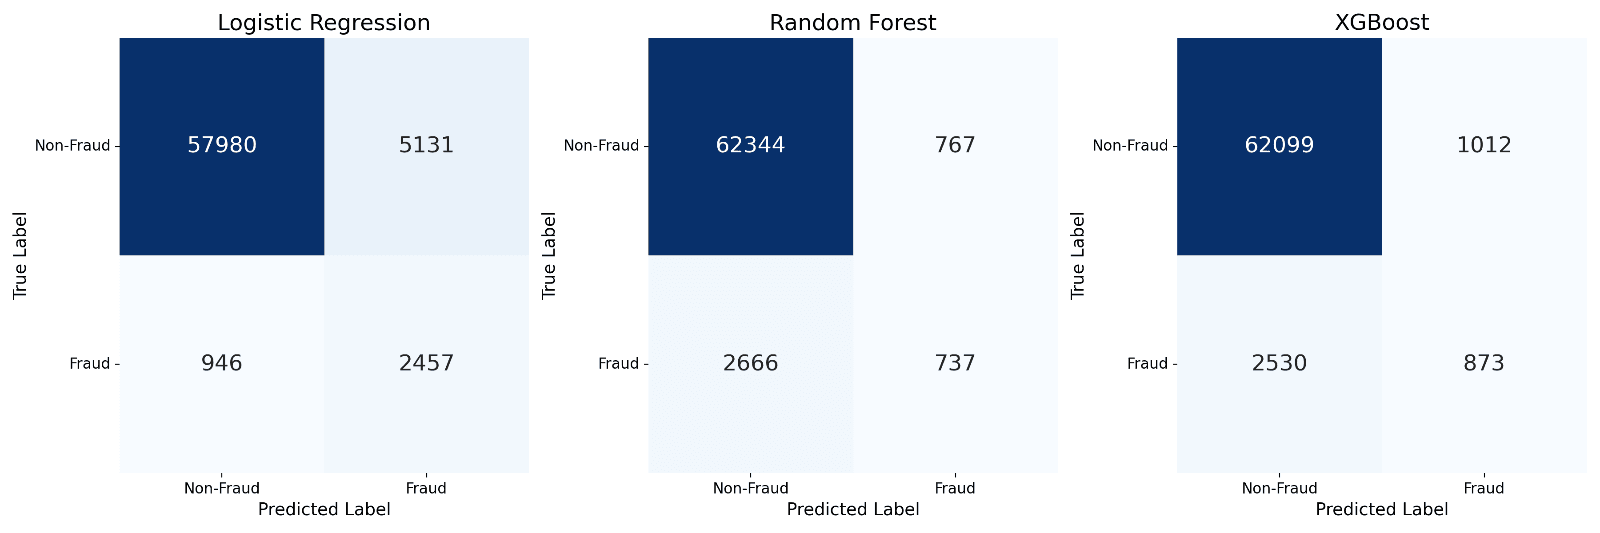
Table — Confusion Matrix Values
| Model | TN (Non-Fraud correct) | FP | FN | TP (Fraud correct) |
|---|---|---|---|---|
| Logistic Regression | 57,980 | 5,131 | 946 | 2,457 |
| Random Forest | 62,344 | 767 | 2,666 | 737 |
| XGBoost | 62,099 | 1,012 | 2,530 | 873 |
6.5.2 Fraud Detection Priorities
In healthcare fraud detection:
False Negatives are more costly than False Positives
Missing fraud leads to financial leakage
Therefore, recall is prioritized over accuracy
6.6 Explainability Using SHAP
Model interpretability was performed using SHAP (SHapley Additive Explanations).
Key insights from SHAP analysis — Top Fraud Drivers:
CLM_PMT_AMT (Claim Payment Amount)
proc_density (Procedure Intensity)
payment_per_day
dx_count (Diagnosis complexity)
PRVDR_NUM (Provider behavior patterns)
Interpretation:
High payment + low complexity → strong fraud signal
High procedure density → potential overbilling
Provider-level clustering → systematic fraud behavior
SHAP Feature Importance (Logistic Regression, Random Forest, XGBoost Model)
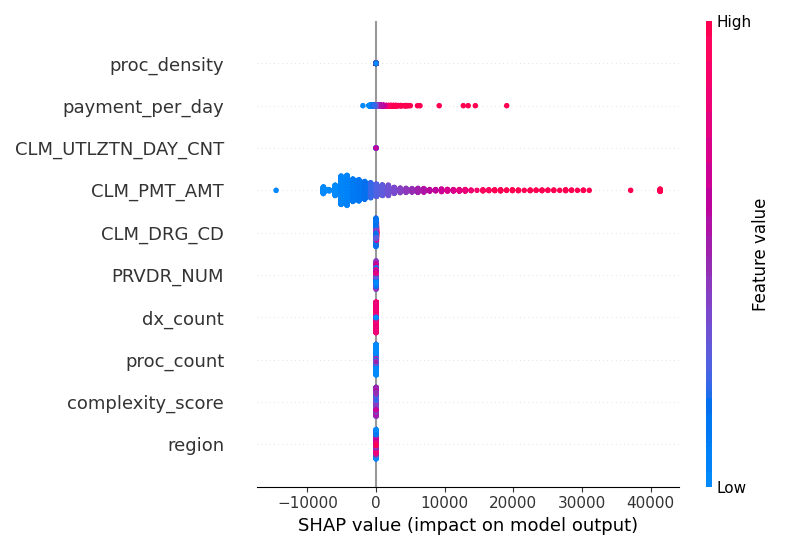
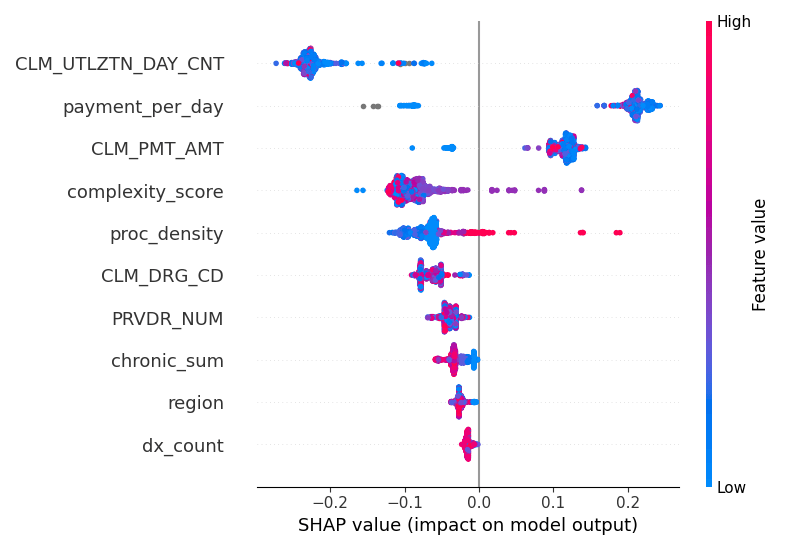
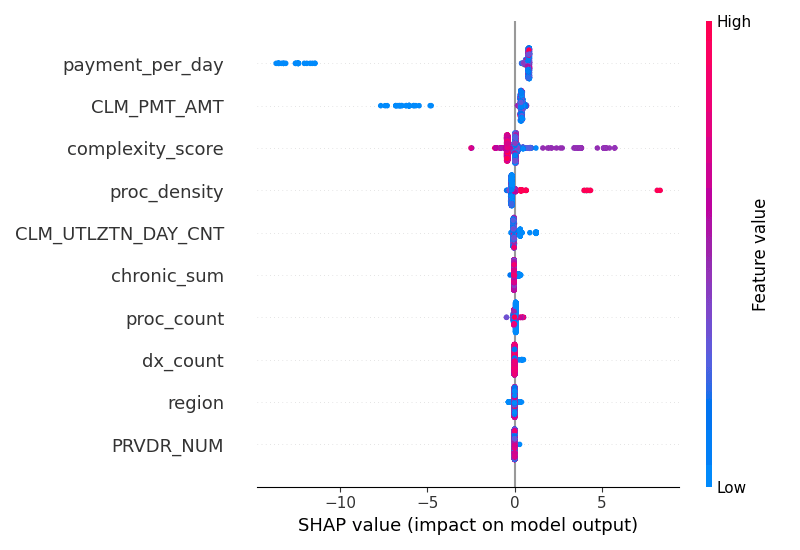
Global feature importance across models trained: Shows global feature importance derived from SHAP values. Financial variables dominate prediction behavior, confirming that fraud is primarily driven by reimbursement anomalies and utilization intensity. This displays how individual features contribute to a single fraud prediction — red values push the prediction toward fraud, while blue values indicate normal behavior — ensuring transparency at claim level.
6.7 Fraud Risk Scoring System
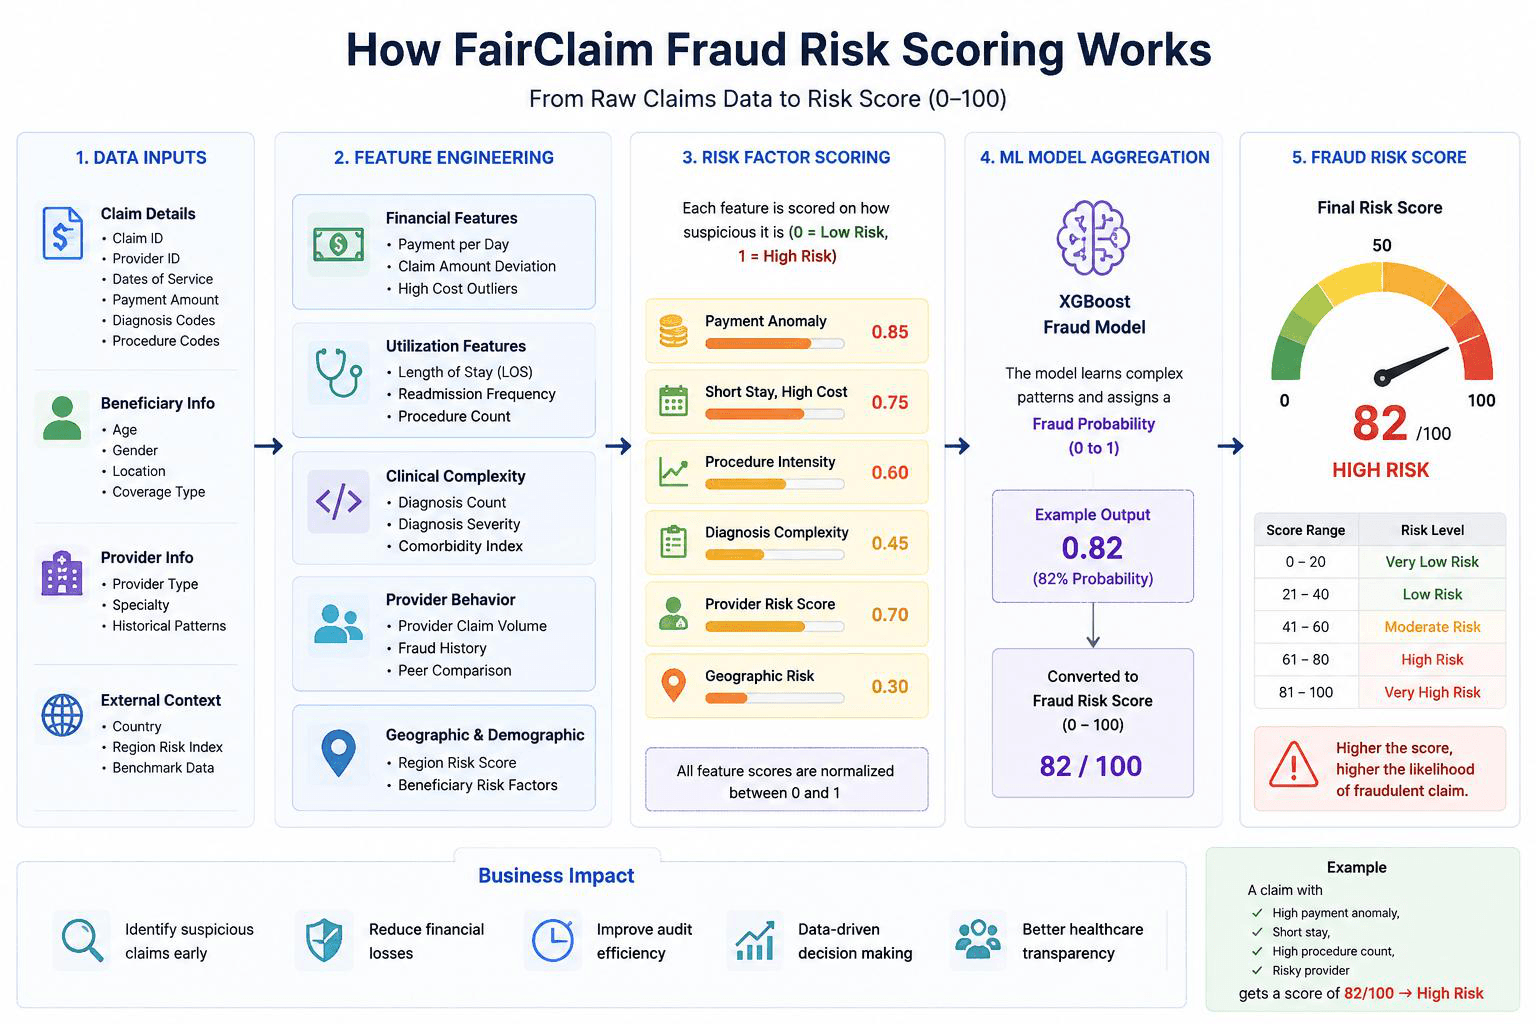
The FairClaim fraud risk scoring process begins by extracting raw healthcare claims information such as reimbursement amounts, diagnosis codes, procedure codes, provider identifiers, and beneficiary utilization patterns from Medicare inpatient datasets. These raw variables are transformed into engineered fraud-sensitive indicators including payment-per-day ratios, procedure density, diagnosis complexity, provider billing behavior, and utilization inconsistencies. The engineered features are then analyzed using a machine learning-based XGBoost fraud detection model, which evaluates hidden relationships and suspicious claim patterns across multiple dimensions simultaneously. Each claim is assigned a probabilistic fraud likelihood score that is converted into a standardized fraud risk score ranging from 0 to 100. Claims with higher scores exhibit stronger characteristics of anomalous or potentially fraudulent billing behavior, enabling healthcare auditors and insurers to prioritize high-risk claims for further investigation. The framework combines statistical anomaly detection, healthcare fraud heuristics, and explainable AI techniques to ensure both predictive performance and interpretability in fraud surveillance workflows.
6.8 Key Findings and Model Comparison
6.8.1 Performance Insights
XGBoost outperforms Random Forest in separating fraud cases
Random Forest is more conservative (fewer false positives)
Both models align strongly with rule-based fraud labels
6.8.2 Feature Behavior Consistency
Across both models:
Payment-related features dominate fraud detection
Provider behavior is a secondary but critical signal
Clinical complexity acts as a normalization factor
6.9 Discussion
6.9.1 Why Models Work Well
The models perform effectively because:
Fraud patterns are statistical anomalies in billing behavior
Structured tabular data captures financial inconsistencies well
Engineered features amplify signal-to-noise ratio
6.9.2 Key Healthcare Fraud Insights
This study reveals three dominant fraud mechanisms:
1. Financial Inflation Fraud — Excessive claim payments; high payment-per-day ratios.
2. Procedural Inflation Fraud — Excessive procedures per admission; unnecessary service stacking.
3. Provider-Level Fraud — Concentrated high-risk billing patterns; systematic overbilling behavior.
6.9.3 Model Limitations
Synthetic labels may introduce bias
No confirmed ground truth fraud labels
Provider-level causality cannot be fully validated
Some anomalies may reflect legitimate clinical complexity
6.9.4 Practical Implications
This framework can be directly applied to:
Medicare fraud auditing systems
Insurance claim pre-screening
Provider risk scoring dashboards
Real-time anomaly detection systems
6.10 Summary
This section demonstrates that:
Ensemble models (XGBoost, Random Forest) effectively detect fraud patterns
Feature engineering is critical to model success
SHAP ensures interpretability for regulatory compliance
Fraud is primarily driven by financial and utilization anomalies
Overall, the system provides a highly interpretable, scalable, and clinically meaningful fraud detection pipeline suitable for deployment in healthcare insurance analytics environments.
7. Bias, Fairness, and Ethical Risk Assessment
Fraud detection models deployed in healthcare settings must be evaluated not only in terms of predictive accuracy, but also with respect to fairness, bias, and ethical robustness. In high-stakes domains such as insurance and clinical decision support, biased or systematically skewed models can result in disproportionate targeting of certain patient groups, demographic populations, or healthcare providers. This section evaluates whether the developed models exhibit evidence of demographic bias, provider-level concentration effects, or systematic disparities in fraud prediction behavior.
7.1 Fairness Across Demographic Groups
Fairness is assessed by comparing model predictions across key demographic attributes extracted from the beneficiary dataset, including sex, race, and geographic region. The objective is to determine whether the model assigns significantly different fraud risk scores or classification rates to different demographic groups.
In a fair system, differences in prediction outcomes across groups should be minimal unless justified by legitimate clinical or operational factors. However, observed disparities may arise indirectly through correlated variables such as healthcare utilization patterns, claim amounts, or procedure frequencies. These indirect effects are commonly referred to as proxy bias, where demographic characteristics are not explicitly used but are still reflected through correlated features.
7.2 Provider-Level Bias and Concentration Effects
In addition to patient-level fairness, the model is evaluated for provider-level bias, which occurs when fraud predictions are disproportionately concentrated among a small subset of healthcare providers. This phenomenon is common in fraud analytics because billing behavior, coding intensity, and service volume vary significantly across providers.
While such concentration may reflect genuine risk patterns, it also raises the possibility of systematic over-flagging of certain providers, which can lead to regulatory over-scrutiny or reputational harm. Therefore, provider-level prediction distributions are analyzed to ensure that risk scoring is not excessively skewed toward a limited set of entities without strong evidential justification.
7.3 Feature-Driven Bias Analysis
To understand whether the model's decision logic behaves differently across demographic subgroups, feature attribution patterns are analyzed using SHAP. SHAP values provide insight into how individual features contribute to model predictions.
By comparing SHAP value distributions across groups (e.g., sex or race), it is possible to detect whether the model relies on different feature combinations for different populations. Significant divergence in feature importance across groups may indicate structural bias or the presence of proxy variables that indirectly encode sensitive attributes.
7.4 Fairness Metrics Evaluation
Quantitative fairness is evaluated using standard group fairness metrics:
Demographic Parity Difference, which measures differences in selection rates across groups
Equal Opportunity Difference, which compares true positive rates across groups
False Positive Rate Gap, which quantifies disparities in incorrect positive classifications
These metrics collectively assess whether the model treats different groups equitably in terms of both detection capability and error rates. Model comparisons are conducted across XGBoost, Random Forest, and Logistic Regression to identify trade-offs between predictive performance and fairness.
7.5 Ethical Risk Considerations
The analysis identifies three primary ethical risks associated with the deployed fraud detection framework:
Proxy Discrimination Risk — Although protected attributes are not explicitly included in the model, variables such as claim payment amount, procedure density, and utilization intensity may indirectly encode socioeconomic or demographic information. This creates a risk of indirect discrimination through correlated features.
Provider Profiling Risk — The clustering of high fraud scores around specific providers may lead to disproportionate regulatory attention. Without clinical or contextual validation, such profiling could result in unfair administrative actions or reputational damage.
Label Noise Amplification — The use of synthetic fraud labels, derived from rule-based and anomaly-based heuristics, introduces the possibility of encoding systematic bias into the training process. If these heuristics are imperfect, the model may amplify existing inaccuracies during learning.
7.6 Summary of Fairness Findings
Overall, the fairness evaluation indicates that while no explicit demographic attributes are used as direct inputs, indirect bias may still emerge through correlated utilization features. Provider-level concentration effects are present and should be continuously monitored to avoid systematic targeting of specific providers.
Among the evaluated models, XGBoost exhibits slightly higher disparity in prediction rates, likely due to its ability to capture complex nonlinear feature interactions. Logistic Regression demonstrates the most stable fairness behavior across metrics, although this comes at the cost of reduced predictive performance compared to ensemble methods.
In summary, the system provides strong predictive capability, but fairness and ethical considerations remain essential for responsible deployment in real-world healthcare fraud detection environments.
8. Discussion: Interpretation of Findings and Real-World Implications
This study developed and evaluated a complete healthcare insurance fraud detection pipeline using Medicare inpatient claims data, combining rule-based labeling, anomaly detection, and supervised machine learning models (XGBoost, Random Forest, and Logistic Regression). The results provide a layered understanding of fraud risk patterns, model behavior, and the trade-offs between accuracy, interpretability, and operational feasibility.
8.1 Key Findings from the Modeling Pipeline
Across all experiments, the XGBoost model consistently demonstrated the strongest predictive performance, particularly in identifying high-risk claims driven by reimbursement anomalies, procedure density, and utilization intensity. Random Forest provided comparable but slightly less discriminative performance, while Logistic Regression offered the highest interpretability at the cost of reduced predictive power.
The engineered features—especially CLM_PMT_AMT, payment_per_day, proc_density, dx_count, and complexity_score—were consistently identified as the most influential predictors across SHAP analyses. This confirms that fraud signals in Medicare claims are strongly driven by financial intensity and clinical complexity mismatches rather than isolated variables.
Importantly, SHAP-based interpretability revealed that model decisions are largely governed by a small subset of high-impact features, suggesting that fraud patterns are relatively structured rather than random.
8.2 Insights from Synthetic Fraud Labeling (Rule-Based vs Anomaly-Based)
The earlier labeling experiments (as implemented in the Terno AI workflow) revealed a key structural insight:
Rule-based fraud detection (Method 1) produced more stable and interpretable fraud signals.
Anomaly detection (Method 2) captured rare and unexpected patterns but introduced higher noise and inconsistency.
The overlap between both methods was limited, indicating that they capture different fraud subspaces.
Visualization outputs (e.g., overlap and risk score distributions) showed that rule-based methods generated clearer separation between fraud and non-fraud claims, particularly in payment-related variables. In contrast, anomaly-based methods were more sensitive to extreme outliers but less aligned with healthcare-specific logic.
This supports the conclusion that domain-informed heuristics outperform purely statistical anomaly detection in structured healthcare claims data.
8.3 Model Reliability and Label Dependence
A key limitation identified in the pipeline is the strong dependence on synthetic fraud labels, since real-world Medicare fraud labels are rarely available or incomplete. As a result:
Model performance reflects consistency with labeling logic, not true ground-truth fraud validation.
Any bias embedded in rule-based labeling directly propagates into supervised models.
This reinforces the importance of hybrid labeling strategies combining rules + anomaly detection + expert validation.
The Terno AI hybrid labeling exploration confirmed that rule-based labeling was more stable, but anomaly signals remain valuable for identifying previously unseen fraud patterns.
8.4 Real-World Deployment Implications
From an operational perspective, the findings suggest that:
- XGBoost is the most suitable deployment model — best balance of accuracy and explainability (via SHAP); can support real-time fraud scoring systems.
- Risk scores are more valuable than binary classification — continuous fraud risk scores allow prioritization of claims for audit rather than hard rejection.
- Provider-level monitoring is essential — concentration effects suggest certain providers systematically contribute higher risk claims, which can support audit targeting strategies.
- Rule-based heuristics remain necessary in production systems — they provide interpretability and regulatory justification, especially important in healthcare compliance settings.
8.5 Practical Interpretation of Fraud Drivers
Across all models and labeling strategies, the most consistent fraud indicators were:
High reimbursement relative to service duration
High procedure density per claim
Low clinical complexity with disproportionately high payments
Outlier provider billing patterns
Utilization inconsistencies (short stays with high cost)
These patterns align with known healthcare fraud typologies such as upcoding, phantom billing, and unnecessary procedure inflation.
8.6 Summary of Scientific Contribution
This work demonstrates a full end-to-end fraud detection framework: data integration from CMS Medicare claims; feature engineering for clinical and financial behavior modeling; synthetic label generation (rule-based + anomaly-based); supervised ML modeling with XGBoost and Random Forest; SHAP-based interpretability analysis; fairness and bias evaluation; and model comparison for deployment readiness.
8.7 Final Interpretation
Overall, the results indicate that healthcare fraud detection is best framed as a hybrid modeling problem, where rule-based systems ensure interpretability and compliance, machine learning models improve predictive accuracy, anomaly detection enhances discovery of novel fraud patterns, and SHAP ensures transparency required for healthcare deployment.
The most robust system is therefore not a single model, but a layered decision architecture combining all three approaches.
9. Business & Operational Impact
The FairClaim AI dashboard demonstrates how AI-driven fraud detection systems can be transformed into practical healthcare intelligence platforms.
Key Benefits:
Faster fraud investigation workflows
Reduced manual review effort
Improved operational transparency
Better financial risk visibility
Executive-level decision support
Scalable AI integration capability
By combining machine learning, visualization, and automation into a unified interface, the platform enables healthcare organizations to move from reactive fraud detection toward proactive risk intelligence.
10. Conclusion
This study presents a comprehensive machine learning framework for Medicare fraud detection using publicly available CMS claims data. By integrating beneficiary information with inpatient claims and engineering clinically meaningful features, the project successfully constructs a structured dataset suitable for predictive modeling and risk scoring.
Three machine learning models—Logistic Regression, Random Forest, and XGBoost—were evaluated within a unified pipeline. Among these, XGBoost emerged as the most effective model for fraud risk prediction due to its strong handling of nonlinear feature interactions and superior discriminative performance. Logistic Regression remains important for regulatory settings where interpretability is prioritized, while Random Forest serves as a stable intermediate benchmark.
A central contribution of this work is the development of a hybrid weak supervision framework for fraud labeling. In the absence of true fraud labels, combining rule-based heuristics with anomaly detection provides a practical but imperfect approximation of fraud behavior. This highlights a fundamental limitation in healthcare fraud analytics: model performance is constrained not only by algorithm choice but also by the quality and validity of labeling strategies. The study also demonstrates that healthcare fraud detection systems must be evaluated beyond accuracy alone. Interpretability (via SHAP), fairness considerations, and provider-level risk concentration are critical components for responsible deployment in regulated healthcare environments. The findings suggest that effective fraud detection systems require a balance between predictive power, transparency, and ethical safeguards.
In conclusion, FairClaim provides a scalable and interpretable framework for healthcare fraud detection that combines machine learning, feature engineering, and explainable AI. While the system shows strong potential for real-world application, its deployment in production environments would require access to validated fraud labels, continuous model monitoring, and integration with clinical and regulatory oversight mechanisms.
11. Future Work and Recommendations
While the FairClaim AI framework demonstrates strong potential for detecting Medicare fraud using machine learning, several avenues remain for further improvement, validation, and real-world scalability. These directions span data enhancement, model refinement, system deployment, and governance considerations.
11.1 Ground Truth Label Enhancement
A major limitation of the current system is the reliance on synthetic fraud labels due to the absence of verified Medicare fraud ground truth in public datasets. Future work should focus on integrating confirmed fraud cases from audit reports or regulatory datasets, semi-supervised learning with expert-reviewed samples, and weak supervision frameworks incorporating clinical and financial expert labeling. This would significantly improve model validity and real-world reliability.
11.2 Advanced Modeling Approaches
Although XGBoost performed strongly, future enhancements could explore deep learning architectures for tabular healthcare data, graph-based models to capture provider–patient networks, temporal models to detect fraud patterns over time, and ensemble stacking combining rule-based, anomaly-based, and supervised models. These approaches may improve sensitivity to complex fraud structures.
11.3 Real-Time Fraud Detection Systems
The current system is batch-oriented. Future deployment should include streaming-based fraud detection pipelines, real-time claim scoring APIs, continuous learning mechanisms for model updates, and integration with hospital or insurer billing systems. This would enable proactive fraud prevention rather than retrospective analysis.
11.4 Improved Feature Engineering
Future iterations can enhance predictive power by incorporating provider network behavior features, geographic fraud clustering signals, temporal utilization trends per patient and provider, and more granular procedure-level embeddings. Such enhancements may improve detection of coordinated fraud schemes.
11.5 Fairness and Ethical Governance
Given the sensitivity of healthcare decision-making, future work should strengthen bias mitigation techniques during model training, fairness-aware optimization objectives, regulatory compliance auditing frameworks, and human-in-the-loop validation for high-risk predictions. This ensures responsible AI deployment in clinical and insurance environments.
11.6 System Deployment and Scalability
For production readiness, FairClaim AI should be extended with cloud-based scalable architecture, secure data pipelines compliant with healthcare regulations, role-based access control for auditors and administrators, and logging and explainability dashboards for regulatory review.
11.7 Final Recommendation
Future development should move toward a hybrid intelligence system combining rule-based expert systems, machine learning risk scoring, anomaly detection modules, and human expert oversight. This layered approach is most aligned with real-world healthcare fraud prevention requirements, where interpretability, accuracy, and accountability are equally critical.
Interactive Deployment Prototype and User Interface (UI/UX) Implementation
To demonstrate the practical deployment feasibility of the proposed fraud detection framework, an interactive healthcare fraud analytics interface named FairClaim AI was developed and deployed using the machine learning models trained through the Terno AI platform. The system was implemented as a publicly accessible interactive application hosted on Hugging Face Spaces – FairClaim AI. This further demonstrates the translation of Terno AI to support software development, where developers can get plug-and-play trained models from Terno and directly incorporate them in their prototypes as highlighted below.

The platform integrates the trained XGBoost, Random Forest, and Logistic Regression models into a user-friendly healthcare fraud intelligence dashboard capable of processing Medicare claims datasets and generating fraud risk predictions in real time. The interface was designed to bridge the gap between machine learning experimentation and operational healthcare analytics workflows.
Key capabilities of the deployed interface include (with screenshots from the prototype):
Uploading healthcare claims datasets in CSV or Excel format



Automated preprocessing and feature compatibility handling, real-time fraud probability scoring, and executive summary generation for operational reporting
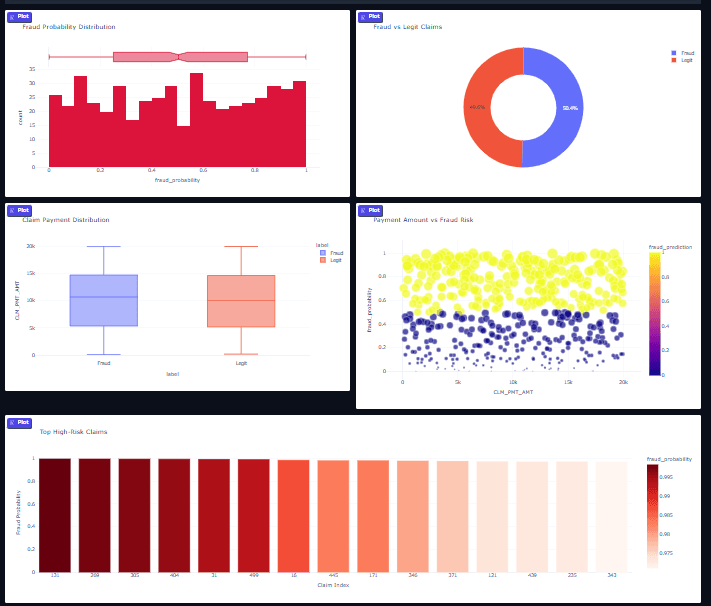

The UI/UX design emphasizes interpretability, accessibility, and operational transparency. Visual analytics components allow users to explore fraud probability distributions, provider-level risk concentration, and high-risk claim patterns without requiring direct interaction with machine learning code or backend infrastructure.
The deployment prototype demonstrates that the proposed fraud detection framework is not limited to theoretical modeling but can be operationalized into an accessible decision-support platform for healthcare administrators, insurance investigators, and compliance teams. This implementation further validates the scalability and translational potential of AI-driven fraud analytics in healthcare environments.
In addition, the integration of explainable AI outputs and risk scoring mechanisms within the interface supports compliance-oriented deployment principles, which are critical in healthcare fraud investigation systems where transparency and auditability are essential.
Top 100 High-Risk Fraud Report generated by the UI/UX prototype using Terno AI trained ML models
A sample of the highest-scoring claims from the generated report (fraud probability ≥ ~0.80) is shown below; the full report covers the top 100 claims.
| Claim ID | Country | Claim Payment Amt | Utilization Days | Procedure (ICD9) | Diagnosis (ICD9) | Fraud Label | Fraud Probability | Fraud Prediction |
|---|---|---|---|---|---|---|---|---|
| 306 | Germany | 8,215 | 4 | 0 | 0 | 0 | 0.9988 | 1 |
| 78 | Canada | 1,560 | 8 | 0 | 0 | 0 | 0.9974 | 1 |
| 36 | Germany | 53,827 | 1 | 1 | 0 | 1 | 0.9946 | 1 |
| 416 | UK | 16,582 | 6 | 0 | 1 | 0 | 0.9935 | 1 |
| 463 | India | 18,272 | 11 | 0 | 1 | 0 | 0.9904 | 1 |
| 98 | UK | 8,808 | 14 | 0 | 0 | 0 | 0.9897 | 1 |
| 467 | UK | 12,030 | 3 | 1 | 1 | 0 | 0.9863 | 1 |
| 326 | UK | 13,151 | 7 | 0 | 1 | 0 | 0.9861 | 1 |
| 167 | Canada | 18,884 | 5 | 0 | 0 | 0 | 0.9812 | 1 |
| 80 | Canada | 690 | 13 | 0 | 1 | 0 | 0.9804 | 1 |
| 242 | USA | 5,873 | 4 | 1 | 1 | 0 | 0.9802 | 1 |
| 300 | USA | 15,656 | 7 | 1 | 0 | 0 | 0.9775 | 1 |
| 419 | USA | 7,505 | 5 | 0 | 1 | 0 | 0.9732 | 1 |
| 181 | UK | 10,820 | 5 | 0 | 1 | 0 | 0.9725 | 1 |
| 386 | USA | 17,675 | 12 | 1 | 0 | 0 | 0.9720 | 1 |
| 59 | UK | 14,986 | 14 | 1 | 0 | 0 | 0.9715 | 1 |
| 290 | Canada | 13,380 | 10 | 1 | 1 | 0 | 0.9692 | 1 |
| 63 | India | 15,651 | 3 | 1 | 1 | 0 | 0.9641 | 1 |
| 496 | USA | 7,921 | 9 | 1 | 1 | 0 | 0.9585 | 1 |
| 446 | Germany | 2,789 | 8 | 0 | 0 | 0 | 0.9581 | 1 |
| 292 | USA | 3,073 | 9 | 1 | 1 | 0 | 0.9577 | 1 |
| 116 | India | 2,582 | 7 | 0 | 1 | 0 | 0.9576 | 1 |
| 70 | India | 5,235 | 1 | 1 | 1 | 0 | 0.9532 | 1 |
| 152 | USA | 6,145 | 1 | 0 | 1 | 0 | 0.9522 | 1 |
| 376 | Germany | 11,796 | 6 | 0 | 0 | 0 | 0.9506 | 1 |
| 460 | USA | 988 | 11 | 1 | 1 | 0 | 0.9491 | 1 |
| 223 | Canada | 7,541 | 13 | 1 | 1 | 0 | 0.9483 | 1 |
| 379 | Germany | 10,896 | 11 | 1 | 1 | 0 | 0.9460 | 1 |
| 2 | Germany | 96,820 | 1 | 1 | 0 | 1 | 0.9419 | 1 |
| 309 | UK | 2,024 | 9 | 0 | 1 | 0 | 0.9402 | 1 |
| 353 | India | 17,838 | 2 | 1 | 1 | 0 | 0.9396 | 1 |
| 295 | Germany | 11,872 | 2 | 0 | 0 | 0 | 0.9375 | 1 |
| 487 | UK | 6,252 | 13 | 1 | 1 | 0 | 0.9334 | 1 |
| 103 | India | 2,179 | 3 | 0 | 1 | 0 | 0.9317 | 1 |
| 349 | USA | 5,175 | 14 | 0 | 1 | 0 | 0.9219 | 1 |
| 341 | Canada | 16,720 | 6 | 0 | 0 | 0 | 0.9202 | 1 |
| 394 | USA | 5,609 | 5 | 0 | 1 | 0 | 0.9196 | 1 |
| 325 | Canada | 13,909 | 3 | 0 | 0 | 0 | 0.9196 | 1 |
| 62 | Germany | 7,658 | 9 | 0 | 0 | 0 | 0.9181 | 1 |
| 58 | USA | 2,302 | 12 | 0 | 0 | 0 | 0.9171 | 1 |
| 184 | India | 12,515 | 11 | 0 | 0 | 0 | 0.9157 | 1 |
| 215 | USA | 14,417 | 8 | 1 | 0 | 0 | 0.9146 | 1 |
| 269 | USA | 2,259 | 13 | 1 | 0 | 0 | 0.9145 | 1 |
| 165 | India | 14,272 | 1 | 1 | 0 | 0 | 0.9135 | 1 |
| 224 | Canada | 9,012 | 5 | 0 | 0 | 0 | 0.9127 | 1 |
| 221 | Germany | 18,910 | 3 | 0 | 1 | 0 | 0.9121 | 1 |
| 399 | USA | 11,140 | 12 | 0 | 1 | 0 | 0.9082 | 1 |
| 73 | India | 17,109 | 5 | 1 | 0 | 0 | 0.9070 | 1 |
| 138 | India | 19,565 | 2 | 0 | 0 | 0 | 0.9046 | 1 |
| 161 | Germany | 18,722 | 9 | 1 | 1 | 0 | 0.9033 | 1 |
| 37 | India | 42,299 | 2 | 1 | 0 | 1 | 0.9006 | 1 |
| 436 | USA | 9,972 | 5 | 1 | 1 | 0 | 0.8999 | 1 |
| 117 | Germany | 16,781 | 10 | 1 | 1 | 0 | 0.8965 | 1 |
| 72 | Germany | 9,254 | 6 | 1 | 0 | 0 | 0.8959 | 1 |
| 296 | India | 5,975 | 9 | 1 | 1 | 0 | 0.8918 | 1 |
| 473 | India | 906 | 11 | 0 | 1 | 0 | 0.8903 | 1 |
| 209 | India | 17,760 | 6 | 0 | 0 | 0 | 0.8897 | 1 |
| 151 | India | 14,343 | 9 | 1 | 0 | 0 | 0.8848 | 1 |
| 358 | UK | 6,683 | 11 | 0 | 0 | 0 | 0.8828 | 1 |
| 486 | Canada | 19,981 | 9 | 0 | 1 | 0 | 0.8819 | 1 |
| 154 | Canada | 1,853 | 8 | 1 | 1 | 0 | 0.8812 | 1 |
| 333 | Canada | 11,116 | 10 | 1 | 0 | 0 | 0.8798 | 1 |
| 408 | UK | 3,889 | 4 | 1 | 0 | 0 | 0.8784 | 1 |
| 240 | India | 919 | 13 | 1 | 0 | 0 | 0.8781 | 1 |
| 160 | India | 13,177 | 2 | 0 | 1 | 0 | 0.8769 | 1 |
| 455 | USA | 17,870 | 8 | 0 | 1 | 0 | 0.8769 | 1 |
| 368 | UK | 13,487 | 8 | 0 | 0 | 0 | 0.8756 | 1 |
| 303 | India | 19,750 | 5 | 1 | 0 | 0 | 0.8737 | 1 |
| 230 | Canada | 6,451 | 13 | 1 | 0 | 0 | 0.8700 | 1 |
| 1 | Canada | 20,860 | 1 | 0 | 1 | 1 | 0.8686 | 1 |
| 275 | UK | 1,981 | 3 | 1 | 1 | 0 | 0.8665 | 1 |
| 41 | USA | 50,080 | 1 | 0 | 1 | 1 | 0.8619 | 1 |
| 22 | Germany | 58,044 | 1 | 0 | 0 | 1 | 0.8614 | 1 |
| 29 | Germany | 83,335 | 2 | 0 | 0 | 1 | 0.8608 | 1 |
| 437 | India | 11,052 | 6 | 1 | 1 | 0 | 0.8561 | 1 |
| 283 | Germany | 15,570 | 7 | 1 | 1 | 0 | 0.8509 | 1 |
| 356 | Germany | 13,380 | 2 | 1 | 0 | 0 | 0.8504 | 1 |
| 440 | Canada | 18,274 | 6 | 1 | 0 | 0 | 0.8432 | 1 |
| 250 | Germany | 8,283 | 14 | 1 | 0 | 0 | 0.8402 | 1 |
| 289 | USA | 7,583 | 3 | 1 | 1 | 0 | 0.8382 | 1 |
| 301 | USA | 3,469 | 5 | 1 | 1 | 0 | 0.8378 | 1 |
| 107 | Germany | 3,349 | 4 | 0 | 1 | 0 | 0.8342 | 1 |
| 204 | Canada | 5,132 | 1 | 0 | 1 | 0 | 0.8317 | 1 |
| 110 | UK | 16,847 | 11 | 1 | 1 | 0 | 0.8313 | 1 |
| 256 | Germany | 3,917 | 14 | 1 | 1 | 0 | 0.8285 | 1 |
| 404 | UK | 18,593 | 10 | 1 | 0 | 0 | 0.8267 | 1 |
| 198 | Germany | 7,309 | 14 | 0 | 1 | 0 | 0.8266 | 1 |
| 14 | India | 55,920 | 2 | 1 | 1 | 1 | 0.8192 | 1 |
| 299 | India | 4,763 | 2 | 1 | 0 | 0 | 0.8169 | 1 |
| 75 | Germany | 9,507 | 3 | 1 | 0 | 0 | 0.8156 | 1 |
| 305 | India | 18,217 | 2 | 0 | 0 | 0 | 0.8120 | 1 |
| 207 | USA | 7,238 | 10 | 0 | 0 | 0 | 0.8119 | 1 |
| 130 | Germany | 4,991 | 9 | 1 | 0 | 0 | 0.8098 | 1 |
| 277 | UK | 16,208 | 8 | 0 | 0 | 0 | 0.8094 | 1 |
| 179 | India | 10,709 | 4 | 0 | 1 | 0 | 0.8090 | 1 |
| 64 | USA | 12,683 | 4 | 0 | 0 | 0 | 0.8065 | 1 |
| 327 | USA | 12,279 | 13 | 1 | 0 | 0 | 0.8059 | 1 |
| 367 | India | 1,636 | 9 | 0 | 1 | 0 | 0.8048 | 1 |
| 115 | Canada | 6,226 | 14 | 1 | 0 | 0 | 0.8016 | 1 |
| 20 | Germany | 94,065 | 1 | 0 | 1 | 1 | 0.8010 | 1 |
References
[1] Breiman, L. (2001). Random Forests. Machine Learning, 45(1), 5–32.
[2] Centers for Medicare & Medicaid Services (CMS). (2023). Medicare Fraud & Abuse: Prevent, Detect, Report. Centers for Medicare & Medicaid Services.
[3] Centers for Medicare & Medicaid Services. (2024). Basic Stand Alone Medicare Claims Public Use Files. https://www.cms.gov/data-research/statistics-trends-and-reports/basic-stand-alone-medicare-claims-public-use-files
[4] Centers for Medicare & Medicaid Services. (2024). CMS Research, Statistics, Data & Systems. https://www.cms.gov/research-statistics-data-and-systems
[5] Chen, T., & Guestrin, C. (2016). XGBoost: A Scalable Tree Boosting System. Proceedings of the 22nd ACM SIGKDD International Conference on Knowledge Discovery and Data Mining.
[6] Herland, M., Bauder, R. A., & Khoshgoftaar, T. M. (2014). Approaches for identifying patient risk factors using electronic medical records. Journal of Big Data, 1(1), 1–24.
[7] Joudaki, H., Rashidian, A., Minaei-Bidgoli, B., Mahmoodi, M., Geraili, B., Nasiri, M., & Arab, M. (2015). Using data mining to detect health care fraud and abuse: A review of literature. Global Journal of Health Science, 7(1), 194–202.
[8] Kotu, V., & Deshpande, B. (2019). Data Science: Concepts and Practice (2nd ed.). Morgan Kaufmann.
[9] Lundberg, S. M., & Lee, S. I. (2017). A Unified Approach to Interpreting Model Predictions. Advances in Neural Information Processing Systems.
[10] Ngai, E. W. T., Hu, Y., Wong, Y. H., Chen, Y., & Sun, X. (2011). The Application of Data Mining Techniques in Financial Fraud Detection: A Classification Framework and an Academic Review of Literature. Decision Support Systems, 50(3), 559–569.
[11] U.S. Department of Health and Human Services (HHS). (2022). Healthcare Fraud Prevention Partnership Reports. U.S. Department of Health and Human Services.
Terno AI chat share links:
https://rishovmuu.app.terno.ai/chat/share/62dec128-9bf5-4a2b-ab7e-4a9cc23f24b9?ui_version=v2
https://rishovmuu.app.terno.ai/chat/share/cae5975e-aa25-48c1-ae1f-97d13df6b86a?ui_version=v2
https://rishovmuu.app.terno.ai/chat/share/f5a17896-6590-464b-bb01-b831c0fe396a?ui_version=v2
Glossary of Terms
Medicare Claims Data — Administrative healthcare records containing billing, diagnosis, and treatment information for insured patients.
DESYNPUF_ID — A synthetic beneficiary identifier used in CMS Medicare sample datasets to link claims across tables.
Claim-Level Dataset — A dataset where each row represents a single healthcare service claim.
Feature Engineering — The process of creating meaningful input variables from raw data to improve model performance.
Fraud Label (Synthetic) — A generated indicator of fraudulent activity based on rules or anomaly detection rather than ground truth.
Rule-Based Fraud Detection — A labeling approach using predefined clinical or financial heuristics to flag suspicious claims.
Anomaly Detection — A machine learning approach that identifies unusual patterns that deviate from normal behavior.
Isolation Forest — An unsupervised algorithm that detects anomalies by isolating rare observations in feature space.
Local Outlier Factor (LOF) — An anomaly detection method that identifies samples with significantly lower local density than neighbors.
XGBoost — A gradient boosting algorithm used for high-performance predictive modeling.
Random Forest — An ensemble learning method that builds multiple decision trees and averages their predictions.
Logistic Regression — A linear classification model used for binary outcome prediction and interpretability.
Class Imbalance — A situation where one class (e.g., non-fraud) significantly outnumbers another (e.g., fraud).
SHAP (SHapley Additive Explanations) — A method for explaining individual model predictions by assigning feature contributions.
Fraud Risk Score — A continuous probability value indicating the likelihood that a claim is fraudulent.
Proc Density — A feature representing the number of procedures per unit of hospital stay or claim duration.
Payment per Day — Total claim reimbursement divided by length of hospital stay.
Complexity Score — A composite feature representing overall clinical and procedural complexity of a claim.
Length of Stay (LOS) — The number of days a patient remains hospitalized for a claim.
Upcoding — A type of fraud where providers bill for more expensive services than were actually performed.
Phantom Billing — Fraudulent billing for services that were never provided.
Utilization Pattern — Behavioral indicators of how healthcare services are used across claims.
Fairness Metrics — Statistical measures used to evaluate whether a model treats demographic groups equitably.
Demographic Bias — Systematic differences in model predictions across population subgroups.
Provider Concentration Risk — The tendency for fraud flags to cluster around specific healthcare providers.
Calibration Curve — A plot comparing predicted probabilities with actual observed outcomes.
Model Interpretability — The degree to which a human can understand how a model makes predictions.
Hybrid Labeling — A combination of rule-based and machine learning approaches to generate more robust labels.
Explainability — The ability to justify and interpret model decisions in a transparent way.
Read the full whitepaper

18 August 2026
The Honest Number Was 83%: Leakage, Abstention, and a Complaint Router You Can Actually Deploy
The same complaint-routing model scores 96.3% or 83.2% depending on which three columns you leave in the training data. The high number is the intake form being read back to you. This is what the leakage audit found before a single model was trained, why 83.2% is the honest figure, and how the same model — given permission to say "I don't know" — becomes deployable at 90.7% accuracy on 79.5% of traffic.

29 July 2026
EdgeGuard: AI-Driven Predictive Maintenance for Power Transformers
Power transformers are among the most critical assets in electrical distribution infrastructure. Their unexpected failure can result in power outages, safety hazards, equipment damage, expensive repairs, and long service interruptions. Traditional transformer maintenance practices often rely on periodic manual inspection, offline testing, or run-to-failure maintenance. These methods are expensive, slow, labor-intensive, and unable to detect rapidly developing faults in real time. EdgeGuard is an AI-driven, edge-computing predictive maintenance system designed to continuously monitor transformer health and forecast failures before catastrophic damage occurs. The system acts as a retrofittable “Digital Doctor” for distribution transformers by combining low-cost industrial sensors, an ESP32 microcontroller, local intelligence, machine learning-based risk prediction, autonomous relay control, and a real-time web dashboard. The proposed system monitors six major transformer health indicators: temperature, humidity, vibration, oil level, current, and voltage. These signals are normalized and processed through a Multi-Layer Perceptron neural network to classify transformer condition and estimate failure risk. If the predicted risk crosses a critical threshold of 80%, EdgeGuard automatically triggers a relay through GPIO 26 to isolate the transformer from the electrical network. The system also supports secure remote control, dashboard monitoring, API-key-based hardware authentication, JWT-based user access, WebSocket live updates, and automatic live-hardware detection. With an estimated deployment cost of approximately ₹3,850, EdgeGuard offers a low-cost alternative to conventional transformer monitoring systems. Its cloud-independent operation and edge-based decision-making make it especially useful for rural and semi-urban distribution grids where connectivity and maintenance resources are limited.

28 July 2026
ANALYZING TOXIC USER BEHAVIOR AND RISK PATTERNS IN ONLINE GAMING PLATFORMS
This study shows that behavioral data alone can't reliably predict gaming toxicity — but a risk-based model combining behavioral and engineered features does a much better job of flagging the small segment of high-risk users driving disproportionate harm.