1. Executive Summary
Food loss has become one of the most significant challenges affecting global food systems. Every stage between agricultural production and retail experiences losses that reduce food availability, increase environmental pressure, and create economic inefficiencies. Recognizing this challenge, the United Nations included food loss reduction within Sustainable Development Goal (SDG) 12, which focuses on responsible consumption and production. The Food and Agriculture Organization (FAO) measures this through the Food Loss Index (Indicator 12.3.1a), which tracks changes in food loss occurring before retail across major food groups.
This whitepaper analyzes the FAO global Food Loss Index dataset covering 2021, 2022, and 2023. The objective is not to identify the causes of food loss but to convert official index data into decision-ready intelligence for governments, businesses, and sustainability leaders.
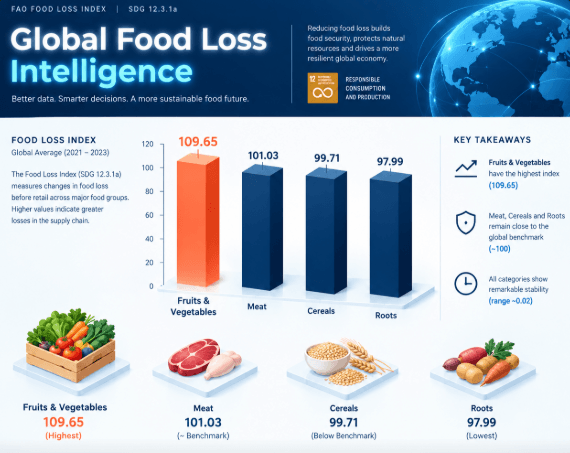
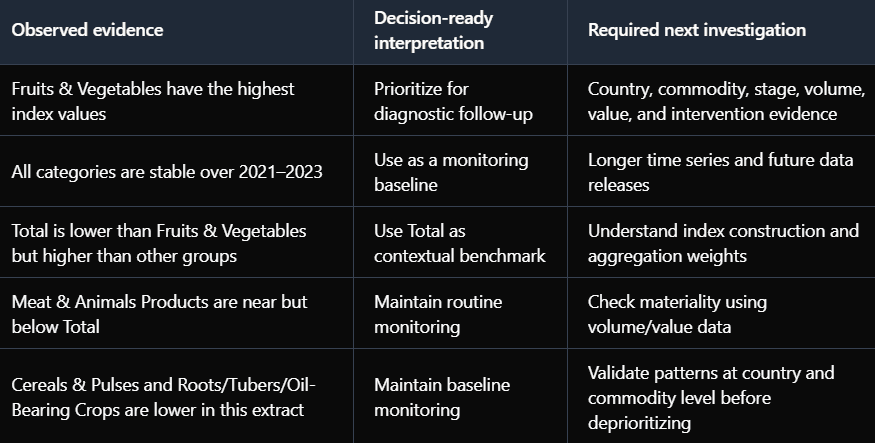
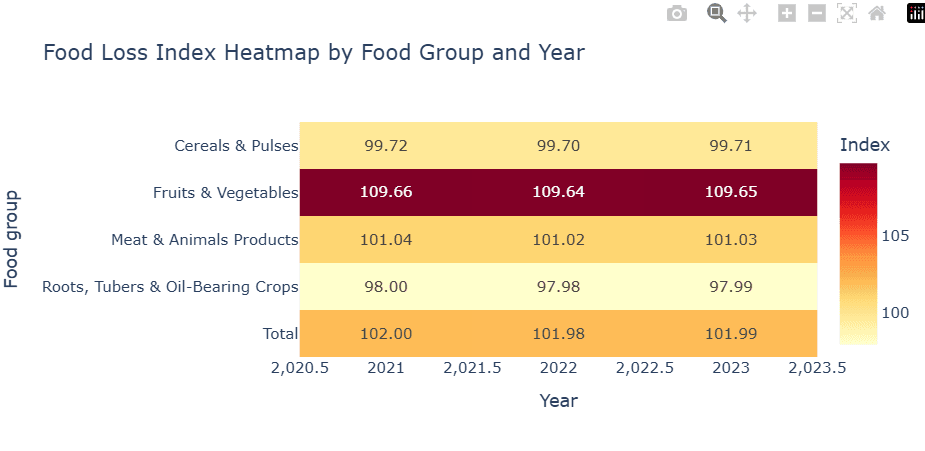
The analysis reveals one consistent finding: Fruits and Vegetables record the highest Food Loss Index in every observed year, with a three-year average index of 109.65. In comparison, Meat and Animal Products average 101.03, Cereals and Pulses average 99.71, and Roots, Tubers, and Oil-Bearing Crops average 97.99.
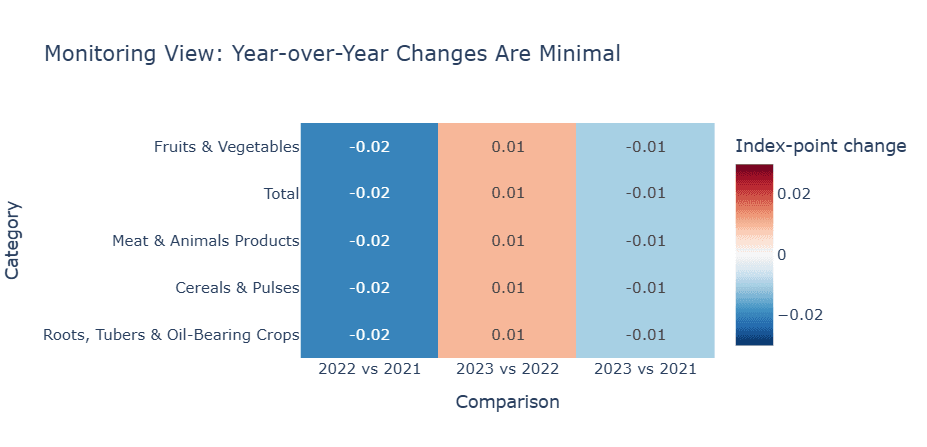
Another important finding is the remarkable stability of the dataset. Every category changes by only about 0.02 index points between years, indicating that the current three-year window should be viewed as a stable monitoring baseline rather than evidence of rapidly changing conditions.
The study develops an executive opportunity matrix that prioritizes categories requiring further investigation. Rather than recommending immediate interventions, the matrix identifies where additional diagnostic work should be concentrated. Fruits and Vegetables emerge as the strongest candidate for deeper analysis because they consistently remain well above the global benchmark represented by the Total Food Loss Index.
For governments, the findings support strengthening monitoring systems and collecting country-level and commodity-level evidence before implementing large-scale policies. For food manufacturers and retailers, the findings suggest comparing internal spoilage and shrinkage data with the external FAO benchmark while avoiding unsupported assumptions about operational causes.
The whitepaper concludes that the Food Loss Index functions best as a strategic screening tool. It provides a reliable high-level signal that helps prioritize further investigation, but effective interventions require additional evidence such as supply-chain-stage data, production volumes, economic losses, and intervention effectiveness studies.
2. Introduction
Food is one of humanity's most valuable resources, yet significant quantities are lost before reaching consumers. Food loss reduces farmer incomes, wastes natural resources, increases greenhouse gas emissions, and threatens food security. As populations grow and climate pressures intensify, reducing food loss has become an important component of sustainable development.
Unlike food waste, which generally occurs at retail and consumer levels, food loss refers to reductions occurring earlier in the supply chain, including harvesting, handling, storage, transportation, and processing before retail. Measuring these losses consistently across countries is challenging because production systems, commodities, and reporting standards differ considerably.
To address this challenge, the Food and Agriculture Organization developed the Food Loss Index as part of SDG Indicator 12.3.1a. Rather than measuring tonnes of food lost directly, the indicator provides an indexed measure that allows comparison across time and product groups.
This whitepaper transforms the FAO index into an executive intelligence report. Instead of attempting causal analysis unsupported by the dataset, the report focuses on three practical questions:
- Which food groups consistently show higher observed Food Loss Index values?
- How stable are these observations over time?
- How can executives use these findings responsibly?
The analysis deliberately avoids overstating conclusions. Since the dataset contains only three years of global observations, it cannot identify country-specific problems, commodity-level issues, or operational failures. However, it provides sufficient evidence for strategic prioritization.
The intended audience includes policymakers, sustainability managers, food manufacturers, retailers, logistics organizations, and researchers interested in evidence-based decision-making.
The report follows a structured approach: understanding the dataset, analyzing patterns, translating findings into executive recommendations, identifying evidence gaps, and proposing future research directions.
3. Global Food Loss and SDG 12.3
Sustainable Development Goal 12 aims to ensure responsible consumption and production. One of its targets, Target 12.3, seeks to reduce food loss and food waste throughout the food system. The indicator is divided into two complementary components:
| Indicator | Governing Body | Supply Chain Focus | Analytical Purpose |
|---|---|---|---|
| SDG 12.3.1a | FAO | Farm gate to pre-retail stages | Measures relative food loss index changes across major product categories. |
| SDG 12.3.1b | UNEP | Retail, food service, and households | Tracks physical food waste volumes at point-of-sale and consumption. |
The FAO Food Loss Index focuses exclusively on losses occurring before retail. This distinction is important because production-stage losses often require different solutions than consumer-level waste.
According to UN agencies, reducing food loss contributes simultaneously to food security, environmental sustainability, and economic resilience. Less food loss means fewer natural resources are wasted, fewer greenhouse gases are emitted unnecessarily, and more food remains available for markets and households.
Major food groups monitored include:
Fruits and Vegetables
Meat and Animal Products
Cereals and Pulses
Roots, Tubers, and Oil-Bearing Crops
The FAO index provides a standardized framework that enables comparison across categories while avoiding problems created by differences in production volume or commodity mix. Although the index itself does not explain why losses occur, it provides valuable signals for monitoring progress toward SDG 12.3 and identifying areas requiring further investigation.
4. Dataset Description
This study uses the official FAO Food Loss Index dataset containing 15 observations across three years.
Dataset Overview & Integrity
| Dataset Attribute | Verified Value |
|---|---|
| Geographic Scope | World Aggregate |
| Temporal Coverage | 2021, 2022, 2023 |
| Total Records | 15 |
| Categories | 5 |
| Missing Values | None |
The five reported categories are:
Total (Global Benchmark)
Fruits and Vegetables
Meat and Animal Products
Cereals and Pulses
Roots, Tubers, and Oil-Bearing Crops
The dataset includes official values only, with no duplicate product-year combinations. The absence of missing values improves analytical reliability, while the small size of the dataset makes every observation transparent and easily verifiable.
One limitation is that the dataset operates strictly at the global level. It cannot identify country-level differences or commodity-specific patterns. Despite these constraints, the dataset provides a reliable foundation for comparative analysis across major food groups.
5. Methodology
The analytical objective was descriptive rather than predictive. Given the compact structure of the dataset (15 observations), applying machine learning or complex causal inference techniques was intentionally avoided to prevent statistical overfitting and unsupported claims.
Several statistical measures were calculated:
Three-year mean Food Loss Index
Minimum and maximum values
Range within categories
Gap versus the Total benchmark
Annual ranking consistency
Year-over-year change
The opportunity matrix was developed using three evidence-based criteria:
Relative Index Level: Position above or below the aggregate benchmark.
Temporal Stability: Multi-year variance across the observed timeline.
Benchmark Position: Position relative to the aggregate Total benchmark.
Categories with consistently higher observed values were identified as higher-priority candidates for future investigation. This approach ensures that executive recommendations remain fully aligned with the evidence actually available.
6. Data Analysis and Key Findings
The analysis produced several clear empirical findings across the 2021–2023 evaluation period.
Mean Food Loss Index (2021–2023)
| Food Group | Mean Index | Position vs. Aggregate Benchmark |
|---|---|---|
| Fruits and Vegetables | 109.65 | Above Total by 7.66 index points |
| Total (Global Benchmark) | 101.99 | Benchmark Context |
| Meat and Animal Products | 101.03 | Below Total by 0.96 index points |
| Cereals and Pulses | 99.71 | Below Total by 2.28 index points |
| Roots, Tubers, and Oil-Bearing Crops | 97.99 | Below Total by 4.00 index points |
Fruits and Vegetables remain approximately 7.66 index points above the Total benchmark, making them the only category consistently operating above aggregate global levels.
Temporal Stability Analysis
Every category changes only minimally across the three observed years:
Fruits and Vegetables Range: 0.02
Meat and Animal Products Range: 0.02
Cereals and Pulses Range: 0.02
Roots, Tubers, and Oil-Bearing Crops Range: 0.02
Total Benchmark Range: 0.02
This extreme consistency indicates that the observed hierarchy remains stable rather than fluctuating wildly year-over-year. Furthermore, category rankings never change across 2021, 2022, and 2023:
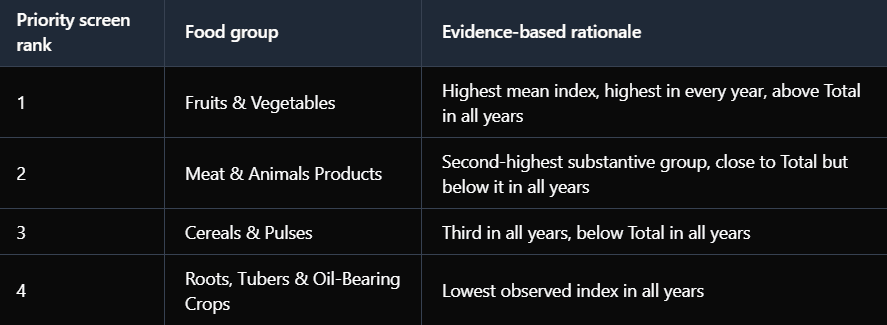
- Fruits and Vegetables (Rank 1)
- Meat and Animal Products (Rank 2)
- Cereals and Pulses (Rank 3)
- Roots, Tubers, and Oil-Bearing Crops (Rank 4)
This consistency strengthens confidence that observed category differences represent structural baselines rather than one-year anomalies.
7. Executive Opportunity Matrix
The opportunity matrix converts statistical findings into structured executive priorities.
Priority Screening Matrix
| Food Group | Priority Tier | Recommended Action Focus |
|---|---|---|
| Fruits and Vegetables | Highest Priority | Primary focus for deeper diagnostic follow-up, country-level research, and supply-chain audits. |
| Meat and Animal Products | Routine Priority | Maintain routine monitoring; evaluate volume/value materiality before funding dedicated studies. |
| Cereals and Pulses | Baseline Priority | Maintain baseline monitoring; verify local country conditions before adjusting priorities. |
| Roots, Tubers, and Oil-Bearing Crops | Baseline Priority | Maintain baseline tracking; evaluate regional infrastructure factors if local discrepancies arise. |
The matrix does not recommend immediate operational interventions. Instead, it identifies diagnostic investigation priorities.
Tier Focus Breakdown
Highest Priority: Fruits and Vegetables require deeper investigation because they consistently remain above the global benchmark. Future diagnostic work should examine specific countries, commodities, supply-chain stages, and economic impacts.
Routine Monitoring: Meat and Animal Products remain close to the aggregate benchmark and deserve continued observation without heavy immediate capital investment.
Baseline Monitoring: Cereals and Roots remain below the aggregate benchmark and should continue being tracked for potential future deviations.
This framework allows executives to allocate analytical resources efficiently before committing major operational capital.
8. Government Strategy
Governments play an important role in reducing food loss by building better evidence and monitoring systems. Three strategic actions emerge from the analysis:
A. Strengthen Data Systems
Countries should complement FAO macro indicators with granular local statistics, including:
Regional agricultural statistics
Commodity-specific data
Local production and harvest volumes
Storage and cold-chain capacity metrics
B. Build Monitoring Dashboards
Annual Food Loss Index releases should be integrated into national sustainability dashboards. Rather than reacting to minor year-to-year changes (such as 0.02 index shifts), policymakers should track meaningful deviations from established historical baselines.
C. Invest After Diagnosis
Large-scale infrastructure interventions and policy grants should follow detailed diagnostic analysis rather than precede it. The FAO dataset identifies where screening attention is needed, but additional national and regional evidence must guide actual capital investment decisions.
9. Industry Strategy
Food manufacturers, retailers, logistics organizations, and agribusinesses can use the FAO index as an external benchmarking tool to contextualize internal operations.
Strategic Commercial Applications
Internal Benchmarking: Organizations should compare internal performance metrics—such as shrinkage, spoilage, customer returns, and inventory losses—against the global category ranking.
Supply Chain Diagnostics: Higher observed category values should trigger operational questions rather than immediate assumptions. Internal operational data should determine whether cold-chain storage, transport conditions, packaging design, demand forecasting, or supplier performance require improvement.
Decision Discipline: Businesses should maintain evidence-based investment discipline. Management must avoid assuming that the highest global index automatically reflects the performance of their individual enterprise operations.
This approach ensures corporate resources target verified operational friction points rather than broad industry generalizations.
10. Monitoring Framework
A practical monitoring framework helps public and private organizations use the Food Loss Index responsibly and systematically.
Layered Monitoring Architecture
| Monitoring Layer | Tracked Metric | Current Baseline | Decision Use | Escalation Trigger |
|---|---|---|---|---|
| Category Level | Mean Index by group | Fruits & Veg: 109.65 |
Identify categories for follow-up | Persistent rise above historical baseline |
| Benchmark Comparison | Gap versus Total | Fruits & Veg: +7.66 |
Compare category to aggregate | Gap widens materially in future releases |
| Stability Tracking | Within-category range | 0.02 for all categories |
Establish baseline stability | Year-over-year change exceeds 0.02 range |
| Rank Monitoring | Category ordinal rank | Unchanged across 3 years | Detect category priority shifts | Rank order changes across releases |
| Evidence Readiness | Disaggregated availability | Not present in dataset | Confirm readiness for intervention | Disaggregated country/stage data released |
Suggested Monitoring Cadence
Annual Cadence: Refresh FAO Food Loss Index values when officially updated (Led by policy analysts and strategy teams).
Quarterly or Monthly Cadence: Compare internal operational loss metrics against category priorities (Led by manufacturers, retailers, and logistics managers).
Annual Strategic Review: Reassess priority categories and identify remaining evidence gaps (Led by executives and sustainability teams).
Pre-Investment Review: Validate macro category signals against local operational and financial data before capital approval (Led by program owners, finance, and operations).
This layered approach ensures that monitoring remains continuous, structured, and evidence-driven.
11. Limitations
Several structural limitations shape the proper interpretation of this study.
Explicit Dataset Boundaries
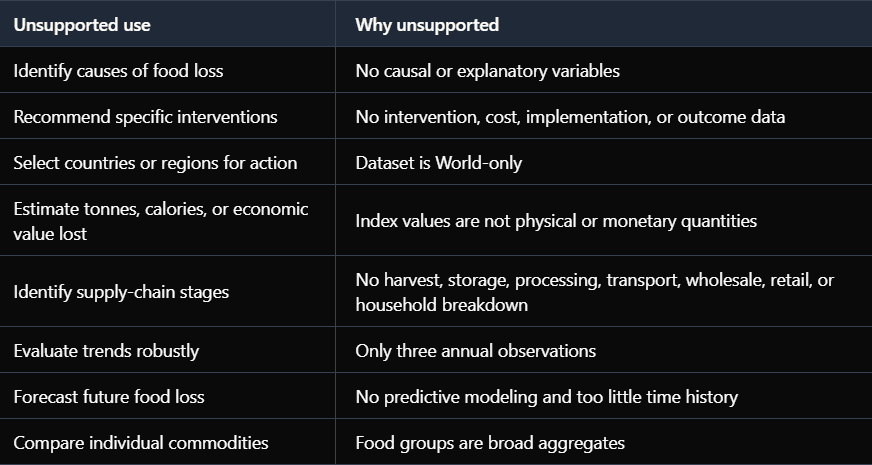
Time Horizon: Contains only three annual observations (2021–2023).
Geographic Scope: Operates strictly at the world aggregate level.
Lack of Country Granularity: Contains no country-specific breakdowns.
Lack of Commodity Detail: Does not differentiate specific crops within broad categories (e.g., apples vs. leafy greens).
Lack of Supply-Chain Stages: Provides no breakdown across harvest, storage, transport, processing, or wholesale.
Absence of Physical Quantities: Does not measure physical loss weight (tonnes) or caloric value.
Absence of Financial Values: Contains no monetary or economic cost figures.
Consequently, the dataset cannot identify the root causes of food loss or prescribe specific operational interventions. The strongest valid conclusion remains category prioritization for deeper diagnostic investigation. Recognizing these limitations increases the credibility of the analysis because executive recommendations remain proportional to the available evidence.
12. Future Scope
Future research and analytical efforts can substantially strengthen decision-making as expanded datasets become available.
Priority Areas for Future Development
- Disaggregated Dataset Integration: Incorporating country-level and regional Food Loss Index statistics.
- Commodity-Level Analysis: Examining granular loss patterns within specific crop and product types.
- Stage-Specific Modeling: Isolating losses occurring specifically at harvest, storage, transport, and processing stages.
- Volume & Financial Integration: Mapping index scores alongside physical production volumes and economic valuation metrics.
- Intervention Evaluation: Assessing the documented effectiveness and cost-benefit ratios of specific post-harvest interventions.
Combining FAO macro indicators with national agricultural statistics and enterprise operational data will enable leaders to transition from high-level screening to precise, high-impact capital investments. Over time, incorporating longer historical time series will also enable predictive analytics and trend modeling.
13. Conclusion
This whitepaper demonstrates that the FAO Food Loss Index is a valuable strategic screening tool for executive decision-making. Across the 2021–2023 dataset, Fruits and Vegetables consistently exhibit the highest Food Loss Index (3-year mean of 109.65), making them the strongest candidate for further diagnostic investigation. At the same time, the remarkable stability of all food groups (0.02 range) indicates that the dataset is better suited for establishing a monitoring baseline than for claiming rapid structural change.
For governments, the index should guide evidence collection and research prioritization rather than immediate policy selection. For businesses, it should function as an external benchmark alongside internal operational metrics such as spoilage, shrinkage, inventory loss, and supplier performance.
The most important takeaway is that the Food Loss Index is the beginning of an evidence pathway, not the end of one. Effective action requires moving from global screening to country-level diagnosis, commodity analysis, operational investigation, and intervention evaluation before implementation. By combining consistent monitoring with stronger supporting datasets, organizations can make more informed decisions that contribute to SDG 12.3 while improving food system resilience, economic efficiency, and long-term sustainability.

10 September 2026
Designing CertusAI: A Compliance-First Enterprise LLM Platform for Regulated Industries
As enterprise adoption pivots from raw model parameter scale to verifiable trust, CertusAI introduces a compliance-first LLM architecture engineered specifically for highly regulated industries. By integrating real-time PII redaction, deterministic policy enforcement, and cryptographically signed audit chains directly into the inference pipeline, CertusAI unlocks agentic AI productivity while ensuring total data sovereignty and statutory compliance.

10 September 2026
E-Commerce Return Intelligence: Analyzing Return Drivers and Predicting Purchase-Time Return
Addressing reverse-logistics friction and return-rate costs in fashion e-commerce, this study leverages the 1.37M-record ASOS GraphReturns dataset to evaluate product, pricing, and country-level return drivers. Using Terno AI for structured analysis alongside a deployed Logistic Regression baseline, the platform provides purchase-time risk scoring to power relative risk ranking, operational prioritization, and non-punitive intervention pilots.

10 September 2026
Optimizing Schedule Integrity via Patient Appointment Intelligence
Most patient no-show models look impressive on paper until they hit production. By rejecting target leakage, confronting a heavy 90/10 class imbalance head-on, and moving beyond raw accuracy, we built a production-ready decision layer that converts raw risk probabilities into actionable clinical interventions.