

Executive Summary
Every complaint a consumer files about a bank, lender, credit bureau or debt collector in the United States is published by the Consumer Financial Protection Bureau (CFPB), together with the company's reported response. Since 2018 that adds up to 17.7 million complaints. Counting them tells you which companies are big. It does not tell you which companies leave consumers without help. This analysis, built with Terno Agentic AI, compares companies by the share of complaints that end in relief, and by how often they respond on time.
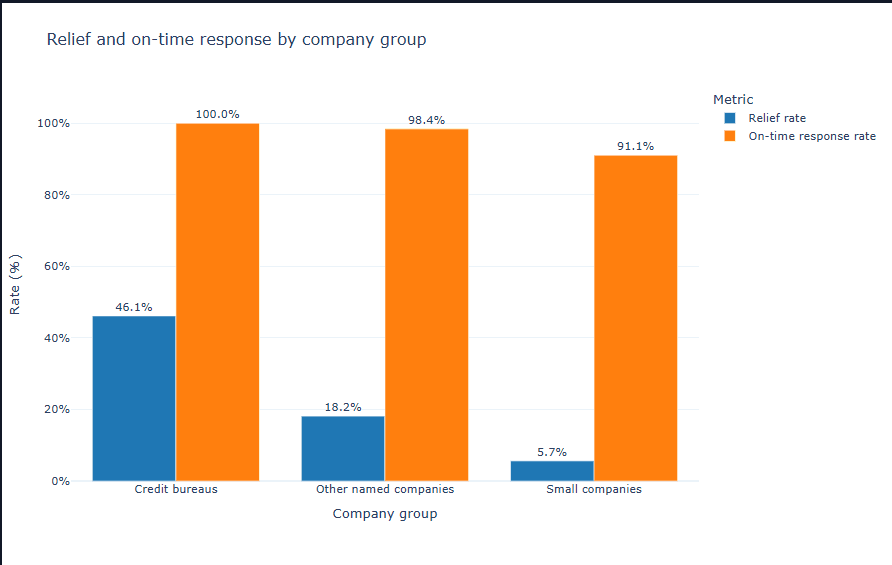
Core Discovery: Company size and company type explain a large part of the gap. Named companies gave relief in 18.18% of complaints from 2018 to 2025. Small companies gave relief in 5.67% and answered on time only 91.05% of the time.
The rest of the findings point to specific places where compliance teams and regulators could look first, rather than to the market as a whole.
Principal Achievements
Reduced a 5.3 GB public file to four summary files with no complaints lost (17,715,190 in, 17,715,190 out)
Answered eleven analysis questions in plain English using Terno, and checked the key figures against the raw data
Showed that three credit bureaus account for 81.8% of complaints and swing between 4.65% and 56.98% relief by year
Found 56 of 177 sizeable debt collectors with exactly 0% relief
Identified companies whose on-time response rate fell sharply, such as MOHELA (97% in 2022 to 42% in 2025)
1. Data and Methodology
1.1 Dataset Characteristics
The analysis uses the public CFPB Consumer Complaint Database, which holds 18,653,525 rows from December 2011 to October 2026. This study uses the 17,715,190 complaints received from 2018 onward. The main fields are:
Company and product: 303 named companies and 10 products, plus one pooled group of small companies
Issue: 95 issue types such as "attempts to collect debt not owed"
Company response: closed with monetary relief, closed with non-monetary relief, closed with explanation, in progress, or untimely response
Timeliness: whether the company responded on time
Consumer tags: Older American and Servicemember
State: all 50 states and DC
1.2 Analytical Framework
Terno's upload limit is 200 MB, so the raw file could not be loaded directly. I used Python once to create four summary files: complaints by company and month, by issue and month, by company, issue and year, and by state, product and year. The eleven questions put to Terno then followed five steps:
- Validation: confirm that all four files agree (17,715,190 complaints each)
- Credit bureaus: year-by-year and month-by-month relief rates for TransUnion, Equifax and Experian
- Weak responders: debt collectors with no relief, the weakest company in each product, and the issues behind their complaints
- Change over time: shifts in relief, complaint growth and late responses
- Synthesis: state differences, Older American and Servicemember shares, and a 46-row scorecard
1.3 Rules and Definitions
Relief rate: (monetary relief + non-monetary relief) divided by (complaints minus those still in progress)
On-time rate: on-time responses divided by all responses with a recorded timeliness
Rates, not counts: large companies always have more complaints
Credit bureaus analysed separately: they make up 81.8% of complaints
Same-product comparisons only
Minimum sizes: 500 complaints to rank a company, 100 for an issue or state cell
Small companies pooled: companies with fewer than 1,000 complaints form one group and are not ranked
Product names merged: three products renamed by the CFPB over time were combined
Preliminary months excluded: complaints from August 2026 onward are still in progress, so the charts use 2018 to 2025
2. Company Size and Responsiveness
2.1 Three Groups, Three Outcomes
Splitting the data into three groups gives the clearest first view. From 2018 to 2025:
Credit bureaus: 9,210,748 complaints, 46.14% relief, 99.99% on time
Other named companies: 2,233,582 complaints, 18.18% relief, 98.44% on time
Small companies (pooled): 299,693 complaints, 5.67% relief, 91.05% on time
Operational Concern: Small companies gave relief about one third as often as named companies, and they answered late nearly six times as often (8.95% of the time against 1.56%). A consumer who complains about a small company is less likely to get help and more likely to wait.
The credit bureaus sit highest, but they are an unusual case. Their rates move a great deal from year to year, as the next section shows.
3. The Credit Bureaus
3.1 Large Year-to-Year Swings
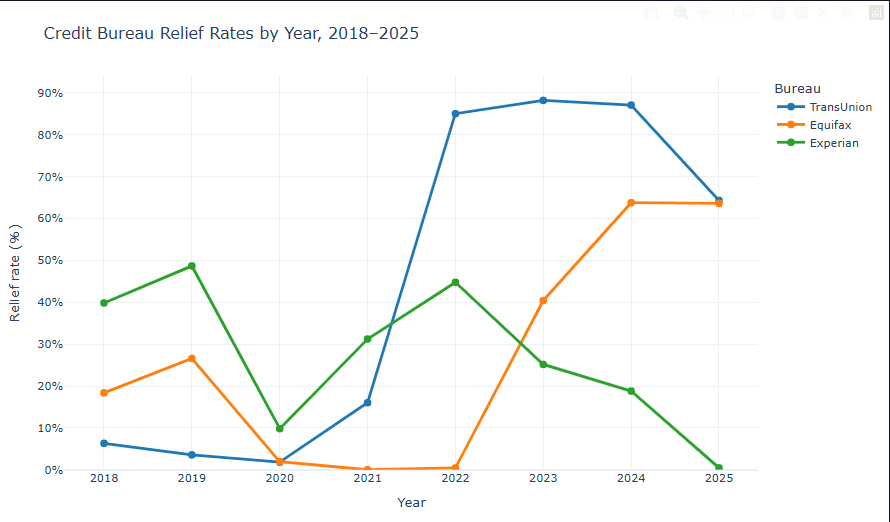
All other companies together stayed between about 15% and 19% relief every year. The bureaus did not. Their combined relief rate was 4.65% in 2020 and 56.98% in 2024.
TransUnion: 16.01% in 2021, 85.04% in 2022, 88.22% in 2023, 64.32% in 2025
Equifax: close to 0% in 2021 and 2022, 40.41% in 2023, 63.61% in 2025
Experian: 48.69% in 2019, 25.16% in 2023, 0.44% in 2025
Monetary relief was 0.35% or less in every row and on-time responses were close to 100%, so these swings come from non-monetary relief.
3.2 The December 2021 Jump
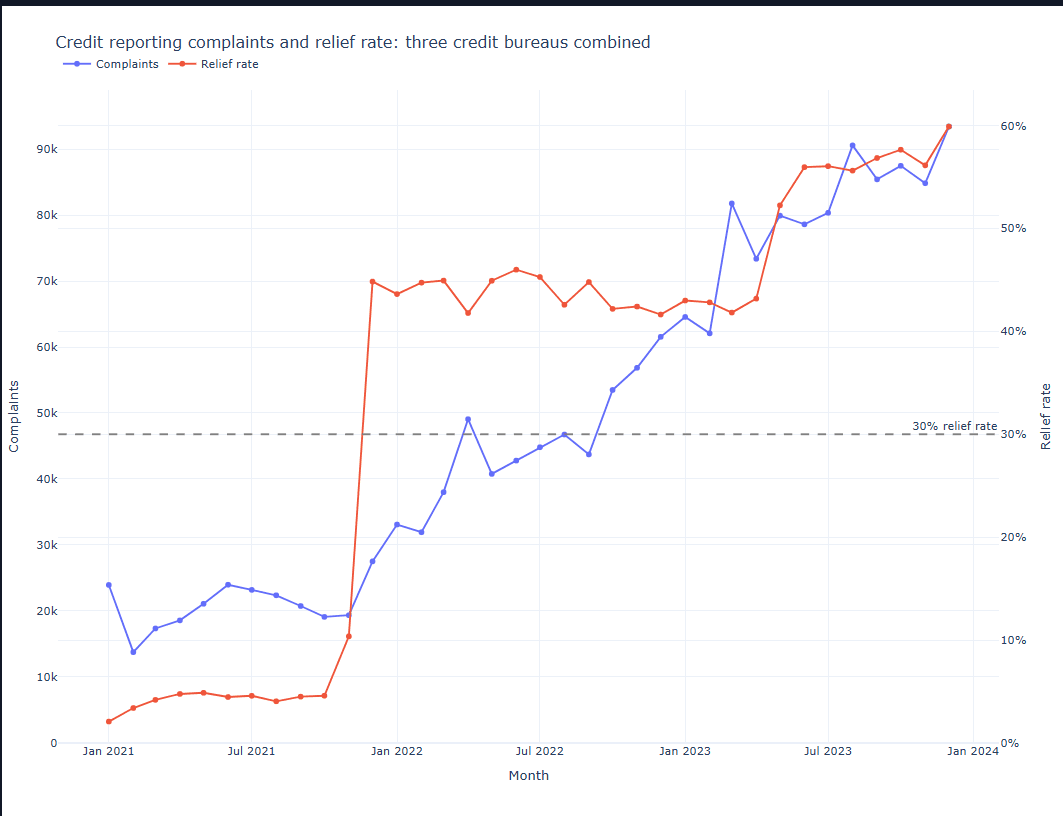
Looking at the three bureaus combined, month by month, shows the change was sudden rather than gradual.
January 2021: 2.07% relief
October 2021: 4.58%
November 2021: 10.36%
December 2021: 44.84%, the first month above 30%
January 2022 to April 2023: between about 42% and 46%
December 2023: 59.91%
Volume Context: Complaints rose from 19,352 in November 2021 to 93,420 a month by December 2023, so the higher relief rate applies to many more cases.
The data shows when the change happened. It does not show why. A change in how bureaus record or handle outcomes is one possible explanation that would be worth checking.
4. Debt Collectors and Other Weak Responders
4.1 Zero-Relief Debt Collectors
Between 2018 and July 2026 there were 665,290 debt collection complaints against 297 companies. Of the 177 with at least 500 complaints, 56 gave relief in exactly 0% of cases and 97 in under 1%. The median was 0.49%. The largest zero-relief collectors were:
National Credit Systems: 14,837 complaints (99.08% on time)
National Credit Adjusters: 7,429
Convergent Resources: 5,024
Affirm: 4,678
NCB Management: 4,577
At these collectors the most common issue was "attempts to collect debt not owed". For example, National Credit Systems had 5,181 complaints of this kind, all at 0% relief. Larger collectors differ widely. Portfolio Recovery gave relief in 43.54% of cases and Resurgent in 23.03%.
4.2 Other Products
The pattern is not limited to debt collection. Among companies with at least 500 complaints:
Money transfer: Block (55,473 complaints) at 0.05% and Early Warning Services (22,405) at 0%, against a product median of 7.45%
Credit reporting: FNIS (15,751 complaints) at 0%
Mortgage: LoanCare (5,738 complaints) and Fay (2,858) at 0%, against a product median of 4.49%
These findings feed a 46-row scorecard of the weakest responders, which is available in the linked Terno conversation.
5. Response Time
5.1 Companies Getting Slower
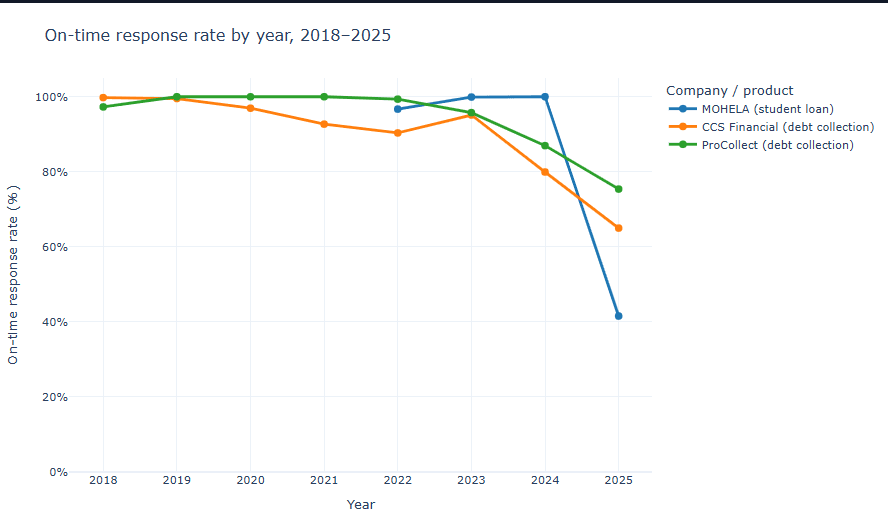
Of the 64 company-product pairs that fell below 95% on time, 54 had data in both years, and 32 of those got worse. Three clear examples:
MOHELA (student loan): close to 100% on time in 2023 and 2024, then 41.52% in 2025, on 22,807 complaints overall
CCS Financial (debt collection): 90.35% in 2022 and 64.98% in 2025
ProCollect (debt collection): 99.36% in 2022 and 75.38% in 2025
Data Quirk: One servicer working under contract with Federal Student Aid shows 0.00% on time on thousands of complaints. This looks like a recording issue, so I did not treat it as a finding.
6. Recommendations
The analysis describes complaints. It does not show why a rate differs, so the recommendations below are about where to look and what to monitor.
6.1 Priority 1: Review the Highest-Volume Zero-Relief Companies First
Justification: Companies such as National Credit Systems, Block and Early Warning Services combine very large volumes with almost no relief, so a review there covers many consumers.
Implementation Steps:
Rank companies by complaint volume among those below 1% relief within the same product
Check how each company codes its outcomes, since "relief" is reported by the company
Read a sample of complaint narratives for the largest cases
6.2 Priority 2: Monitor Credit Bureau Outcomes Monthly
Justification: A single month moved the combined relief rate from 10.36% to 44.84%, and complaint volume kept growing afterward.
Implementation Steps:
Track the combined and per-bureau relief rate every month
Flag any jump above a set threshold, for example 30%, for review
Compare against complaint volume to see how many cases are affected
6.3 Priority 3: Watch On-Time Response Rates
Justification: On-time rates can fall within a single year, as they did at MOHELA between 2024 and 2025.
Implementation Steps:
Flag any company-product pair that falls below 95% on time
Check for sample size and recording quirks before escalating
Review pairs that worsened year over year
6.4 Method Note
Compare companies by rate, within the same product, with a minimum number of complaints. Without these rules the rankings reward being small and penalise being large.
7. Limitations
Self-reported outcomes: each company reports its own response, and companies may record "relief" differently
Complaints are not all problems: the database only holds complaints that were filed, and it is not a random sample
Preliminary data: complaints from August 2026 onward are still open, so the charts stop at 2025 or earlier
Ties at zero: many rankings tie at exactly 0%, so rank within the tie is arbitrary
Pooled small companies: they cannot be ranked one by one
Descriptive only: the analysis does not show why a rate differs or that any company broke a rule
8. References and Methodology
Terno AI: Agentic AI platform for data science. Available at https://terno.ai
Complete analysis documentation: full conversation history and computational steps: https://tushar9.app.terno.ai/chat/share/8c17ae4e-b597-430a-9f2b-e30d30161be0?ui_version=v2
Dataset source: Consumer Financial Protection Bureau, Consumer Complaint Database. Available at https://www.consumerfinance.gov/data-research/consumer-complaints/
Data preparation: Python with pandas, reading the 5.3 GB file in chunks of 500,000 rows
Validation approach: file totals reconciled to 17,715,190 complaints, and the key figures in this post were recomputed independently from the raw data
Conclusion
This investigation shows how a very large public dataset can be turned into a clear view of consumer complaint outcomes using plain-English questions in Terno Agentic AI. Four findings stand out:
- Company type matters: named companies gave relief in 18.18% of complaints against 5.67% for small companies
- Credit bureau outcomes are unstable: relief ranged from 4.65% to 56.98% by year and jumped from 10.36% to 44.84% between November and December 2021
- Many collectors give no relief: 56 of 177 sizeable debt collectors gave relief in exactly 0% of cases
- Some companies are slowing down: MOHELA fell from close to 100% on time in 2024 to 41.52% in 2025
The workflow itself is the other result. A 5.3 GB file became four small summary files, eleven questions and four charts, and the key numbers held up when recomputed from the raw data. The next step is to repeat the method on a second dataset.

22 October 2026
Spatial Arbitrage Dynamics, Climate Shock Elasticity & MSP Deficit Analysis in Indian Mandi Systems
An institutional econometric study analyzing 75,000 verified APMC mandi records across 13 Indian states and 5 commodities using the Terno Agentic AI Platform. The whitepaper isolates spatial arbitrage breakdowns (inter-district spreads up to ₹5,752/q), verifies Wheat Minimum Support Price (MSP) compliance at 96.83%, and models non-linear climate shock price transmission.

10 September 2026
Optimizing Schedule Integrity via Patient Appointment Intelligence
Most patient no-show models look impressive on paper until they hit production. By rejecting target leakage, confronting a heavy 90/10 class imbalance head-on, and moving beyond raw accuracy, we built a production-ready decision layer that converts raw risk probabilities into actionable clinical interventions.
10 September 2026
Global Food Loss Intelligence: Strategic Screening & Decision Framework
An executive decision-support whitepaper translating the official FAO Food Loss Index (SDG Indicator 12.3.1a) into actionable intelligence for 2021–2023. This study establishes a data-driven monitoring baseline across major commodity groups, identifying Fruits & Vegetables (3-year mean index of 109.65) as the primary priority for diagnostic follow-up while offering structured strategies for public policy, industry benchmarking, and evidence-based resource allocation.