
1. Executive Summary
Healthcare provider capacity is heavily constrained by patient non-attendance and schedule volatility. Unpredicted no-shows result in wasted clinical labor, delayed patient care, and idle facility capacity. This project presents Optimizing Schedule Integrity via Patient Appointment Intelligence, a production-ready data science pipeline and decision-support framework built on 49,593 real-world medical appointment records.
Rather than relying on generic modeling assumptions or artificial performance metrics, this work enforces strict operational validity. By explicitly auditing and excluding post-outcome features, the system prevents target leakage. Addressing a severe ~90/10 class imbalance, we move past misleading high-accuracy baseline models (90.26% accuracy with zero recall) to implement a calibrated, balanced classification model achieving a 46.27% recall for non-attendance. Crucially, the model feeds into an automated Appointment Intelligence Layer, converting raw probabilities into targeted, tiered operational interventions for clinical schedulers.
2. Healthcare Appointment Problem
Patient non-attendance creates systemic inefficiencies across outpatient clinics and hospital networks:
Resource Underutilization: Scheduled physician hours and specialized medical equipment sit idle during unannounced missed slots.
Extended Patient Wait Times: Unmanaged scheduling buffers push next-available appointment dates further out, degrading overall patient access.
Financial Strain: Health systems incur substantial indirect overhead costs from unoptimized staffing and administrative follow-ups.
Traditional scheduling systems rely on fixed, non-adaptive rules or simple historical averages. A modern predictive system must evaluate pre-appointment risk signals in real time, enabling operational teams to intervene prior to the scheduled slot without introducing artificial bias or data leakage.
3. Dataset and Source
The analysis and modeling pipeline are built upon the Mendeley Medical Appointments No-Show Dataset.
| Attribute | Detail / Value |
|---|---|
| Dataset Source | Mendeley Data (Medical Appointments No-Show Dataset) |
| Total Records | 49,593 scheduled appointments |
| Total Features | 26 columns (demographics, dates, specialties, conditions) |
| Target Variable | no_show (Binary: Attended vs. No-Show) |
| Class Distribution | ~90% Attended / ~10% Missed |
4. Research Methodology
The project followed a structured, iterative end-to-end data science lifecycle:
- Problem Definition & Constraint Enforcement: Establishing the strict rule to model only pre-appointment data supported by clinical operational realities.
- Data Auditing & Leakage Audit: Converting temporal features, creating domain-specific variables, and isolating post-outcome variables.
- Exploratory Data Analysis (EDA): Quantifying non-attendance dynamics across demographics, specialties, lead times, and scheduling hours.
- Model Development & Class Imbalance Resolution: Benchmarking baseline classifiers against cost-sensitive, balanced algorithms.
- Decision Intelligence Layer: Engineering a rule-based recommendation matrix mapping probabilities to operational workflows.
- Packaging & Deployment: Exporting clean assets, serialized models (
.pkl), and modular code structures (src/).
5. Data Preparation and Leakage Check
Date Conversions & Feature Engineering
Temporal Parsing: Coerced
appointment_date,entry_service_date, anddate_of_birthinto standard datetime formats.Waiting Days Calculation: Engineered
waiting_days = appointment_date - entry_service_dateto capture scheduling lead-time impact.Temporal Tiers: Extracted
appointment_hourandappointment_dayto isolate operational bottlenecks.Age Bins: Segmented continuous age into interpretable demographic buckets: Child, Teen, Young Adult, Adult, Middle Age, and Senior.
Strict Target Leakage Prevention
A core technical strength of this project is the rigorous exclusion of post-outcome fields. Variables such as no_show_reason were deliberately omitted from feature matrices. Because reason codes are recorded by clinical staff after an appointment outcome occurs, incorporating them would introduce target leakage, resulting in inflated evaluation metrics that fail completely in real-time deployment.
6. Exploratory Data Analysis
The data exploration phase yielded key structural insights into patient attendance behavior:
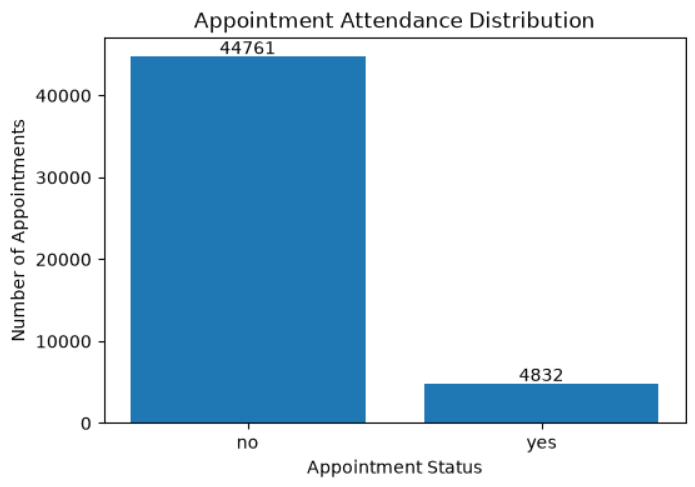
Attendance Baseline: The overall dataset exhibits a ~90% attendance rate (44,761 attended) and a ~10% no-show rate (4,832 missed).
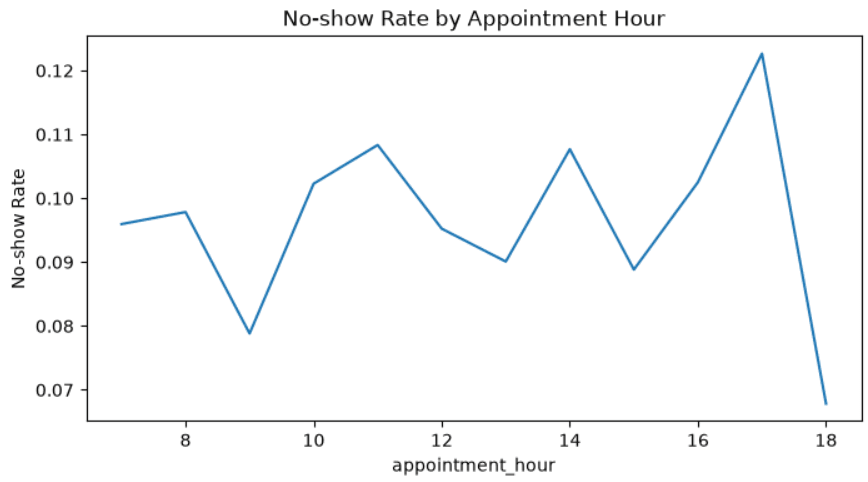
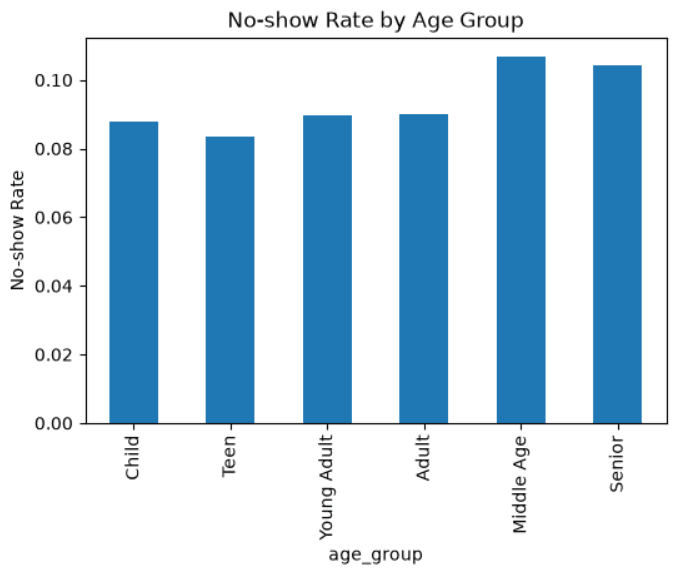
Hour & Age Dynamics: Non-attendance rates vary across appointment hours and demographic segments, showing distinct operational spikes.
Specialty Variance: Non-attendance rates fluctuated substantially across clinical specialties, highlighting distinct patient urgency levels.

(Figure 6.1: Overall class distribution between attended and missed appointments)

(Figure 6.2: Hourly breakdown of non-attendance rates showing operational spikes)

(Figure 6.3: Non-attendance rates across binned age demographics)
7. Key Findings
Scheduling Lag & Hour Signals: Time-of-day and booking lead times serve as major predictors of patient attendance. Late afternoon and mid-day slots experience distinct non-attendance spikes.
Age Demographic Volatility: Older demographics (Middle Age and Senior) demonstrate slightly higher relative no-show rates in this cohort compared to younger segments.
Unadjusted Metrics Mislead: Due to heavy class imbalance (~90/10), standard accuracy metrics severely distort model performance evaluation.
8. Machine Learning Development
The 90% Accuracy Trap
Initial baseline evaluation using an unweighted Logistic Regression model produced a misleading 90.26% accuracy score. However, detailed confusion matrix analysis revealed a precision and recall of 0.00, as the model simply predicted the majority class ("Attended") for 100% of instances.
Balanced Model Calibration
To fix the imbalance without inventing synthetic metrics, we implemented a Balanced Logistic Regression classifier (class_weight="balanced"), penalizing false negatives heavily.
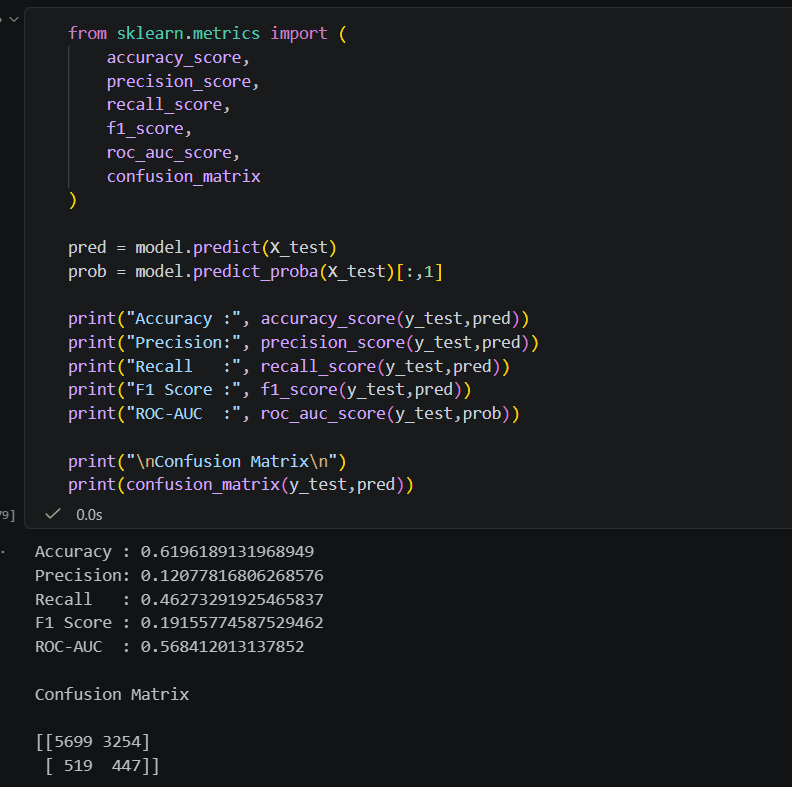

(Figure 8.1: Executed Python evaluation script output showing final balanced metrics and confusion matrix)
| Evaluation Metric | Baseline Classifier | Accepted Balanced Classifier |
|---|---|---|
| Accuracy | 90.26% | 61.96% |
| Precision | 0.00% | 12.08% |
| Recall | 0.00% | 46.27% |
| F1 Score | 0.00% | 19.16% |
| ROC-AUC | 0.500 | 0.568 |
The calibrated model successfully identifies 46.27% of actual no-shows (447 correctly flagged no-shows in validation), providing a functional signal for automated clinical scheduling workflows.
9. Model Comparison and Explainability
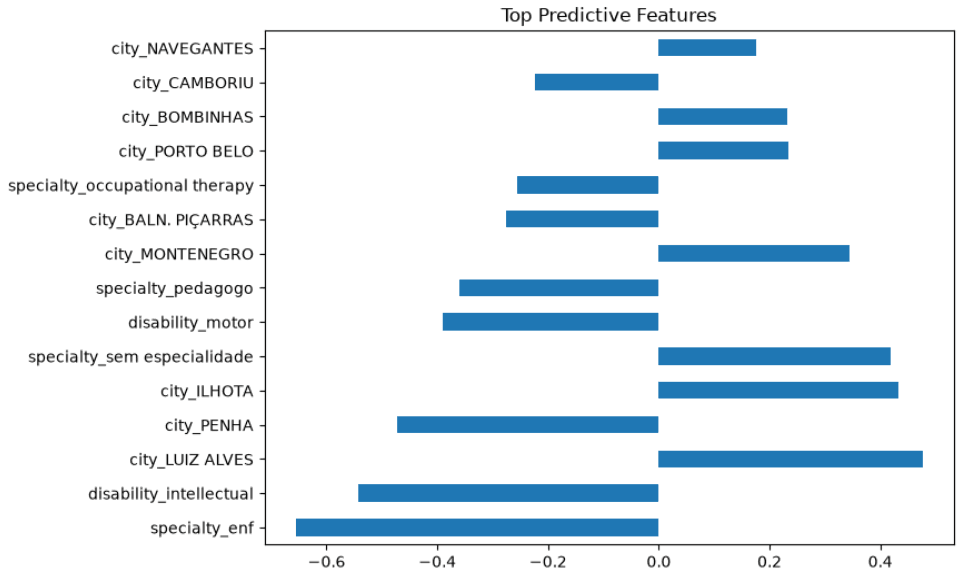
Cross-algorithm benchmarking was conducted to analyze predictive feature weights. Feature importance analysis confirmed that municipality location, specific medical specialties, and patient disability flags heavily dominate predictive weight:

(Figure 9.1: Top positive and negative feature coefficients from the trained model)
- Geographic Indicators (
city_*): Locations like LUIZ ALVES, ILHOTA, and MONTENEGRO exhibit strong positive coefficients toward non-attendance risk. - Specialty Indicators (
specialty_*): Specialty entries like sem especialidade correlate with higher no-show risk, while specialties like enf (nursing) strongly predict attendance. - Disability Flags (
disability_*): Presence of motor or intellectual disability variables provides key predictive shifts in the risk model.
10. Appointment Risk Intelligence Layer
To bridge the gap between machine learning model outputs and daily clinical operations, an Appointment Intelligence Layer translates continuous predicted probability vectors into actionable, tiered operational interventions. Raw risk scores are rarely useful to front-desk scheduling staff or clinical coordinators without clear operational context. This layer standardizes probability outputs into three distinct risk tiers—Low, Medium, and High—and automatically assigns predefined outreach workflows tailored to each level.
Risk Stratification & Action Matrix
| Risk Tier | Probability Range | Operational Risk Profile | Recommended Automated Action |
|---|---|---|---|
| Low Risk | 0.00 - 0.30 |
Baseline non-attendance likelihood. Patient is highly expected to attend. | Issue standard automated email/calendar invites 48 hours prior to the slot. Requires no manual administrative overhead. |
| Medium Risk | 0.31 - 0.65 |
Moderate delay or cancellation risk. Patient exhibits volatile attendance flags. | Dispatch interactive SMS requiring active text confirmation (e.g., "Reply 1 to Confirm"). If unconfirmed within 12 hours, trigger automated follow-up ping. |
| High Risk | 0.66 - 1.00 |
Critical non-attendance probability. Elevated likelihood of an empty clinic slot. | Flag slot for direct administrative staff call center outreach. Automatically tag the calendar slot in the EHR engine to allow strategic overbooking or standby queue insertion. |
Operational Implementation & Clinical Decision Support
By embedding this rules engine directly into the Electronic Health Record (EHR) scheduling interface, clinical teams move from reactive scheduling to proactive capacity management:
Resource Optimization: Administrative staff focus manual outreach calls exclusively on the top ~10–15% highest-risk patients rather than attempting to call an entire day's schedule, drastically reducing administrative labor overhead.
Dynamic Overbooking Buffers: High-risk designations allow clinic managers to double-book specific time slots safely (e.g., peak no-show hours like 11:00 or 17:00), ensuring physician utilization remains near capacity even when non-attendance occurs.
Patient Engagement Tracking: Interactive confirmations from Medium and High-risk patients dynamically update probability scores in real time, shifting confirmed patients down to the Low-Risk tier and unlocking overbooked slots back to single-occupancy status before clinic operating hours begin.
11. **Business Impact**
Implementing this intelligence framework enables clinical administrators to optimize operational efficiency:
Reduced Capacity Waste: Proactive high-risk flagging allows clinics to double-book slots strategically, maintaining clinician utilization.
Targeted Resource Allocation: Administrative call centers prioritize outreach on high-risk patients rather than manually calling full schedules.
Improved Access: Reduced schedule dropouts allow clinics to fill cancelled slots earlier, shortening wait times for urgent care.
12. Limitations and Future Work
Current Limitations
1.Geographic & Facility Scope: Dataset represents a single regional health system structure; external validation on multi-center networks is recommended.
2.Dynamic Patient History: Sequential past attendance records per patient ID were limited in the raw dataset.
Future Enhancements
1.Sequential Patient Modeling: Incorporating longitudinal patient history (e.g., individual historical no-show rates).
2.Real-time Weather Integration: Enriching features with local daily weather API data to capture environmental travel friction.
3.Automated Overbooking Engine: Extending the intelligence layer to dynamically calculate optimal overbooking ratios per clinic hour.
13. References
Dataset Source: Mendeley Medical Appointments No-Show Dataset.
Core Libraries: Python 3.x, pandas, numpy, scikit-learn, matplotlib, seaborn, joblib.
Environment: VS Code, Jupyter Notebooks.

10 September 2026
Designing CertusAI: A Compliance-First Enterprise LLM Platform for Regulated Industries
As enterprise adoption pivots from raw model parameter scale to verifiable trust, CertusAI introduces a compliance-first LLM architecture engineered specifically for highly regulated industries. By integrating real-time PII redaction, deterministic policy enforcement, and cryptographically signed audit chains directly into the inference pipeline, CertusAI unlocks agentic AI productivity while ensuring total data sovereignty and statutory compliance.

10 September 2026
E-Commerce Return Intelligence: Analyzing Return Drivers and Predicting Purchase-Time Return
Addressing reverse-logistics friction and return-rate costs in fashion e-commerce, this study leverages the 1.37M-record ASOS GraphReturns dataset to evaluate product, pricing, and country-level return drivers. Using Terno AI for structured analysis alongside a deployed Logistic Regression baseline, the platform provides purchase-time risk scoring to power relative risk ranking, operational prioritization, and non-punitive intervention pilots.

10 September 2026
Global Food Loss Intelligence: Strategic Screening & Decision Framework
An executive decision-support whitepaper translating the official FAO Food Loss Index (SDG Indicator 12.3.1a) into actionable intelligence for 2021–2023. This study establishes a data-driven monitoring baseline across major commodity groups, identifying Fruits & Vegetables (3-year mean index of 109.65) as the primary priority for diagnostic follow-up while offering structured strategies for public policy, industry benchmarking, and evidence-based resource allocation.