
Abstract
This study investigates the relationship between AI hallucination risk and human collaboration effort across 207,862 human–AI interactions. As AI systems become increasingly integrated into analytical and decision-making workflows, understanding how unreliable or ambiguous outputs affect human efficiency is becoming increasingly important.
A proxy-based evaluation framework is proposed to estimate hallucination risk without requiring ground truth validation. The Hallucination Risk Score (HRS) is derived from internal response signals, including uncertainty, vagueness, contradiction, and response expansion, while the Collaboration Effort Proxy (CEP) estimates human effort using response length and interaction complexity characteristics.
Results reveal a moderate positive relationship between hallucination risk and collaboration effort (r = 0.40, p < 0.001). High-risk interactions consistently required greater collaboration effort and were associated with longer and more imbalanced AI responses. Signal-combination analysis further showed that co-occurring uncertainty, contradiction, and excessive response expansion produced the highest collaboration burden.
Machine learning evaluation further demonstrated that combining hallucination-risk and response-behavior features improved interaction-efficiency prediction, highlighting the joint influence of hallucination-related behavior and response verbosity on human–AI collaboration efficiency.
Keywords: hallucination risk · collaboration effort · human–AI interaction · proxy evaluation · large language models · Terno AI
At a glance
| Metric | Value |
|---|---|
| Interactions Analyzed | 207,862 (full dataset, Terno AI SQL) |
| HRS–CEP Correlation | r = 0.40, moderate positive, p < 0.001 |
| High-Risk Interactions | 6.59% (highest observed collaboration burden) |
| Longer High-Risk Responses | 116% longer vs. low-risk (356 vs. 165 words) |
Document overview
1. Introduction — Context, motivation, and scope of the study
2–3. Problem Statement & Related Work — Research gaps, hallucination literature, limitations of existing methods
4. Proposed Framework — HRS and CEP constructs, interaction classification thresholds
5–6. System Architecture & Implementation — Terno AI pipeline, feature engineering, SQL-based workflow
7. Use Case Walkthrough — End-to-end demonstration on 207,862 interactions
8. Results & Evaluation — Distribution analysis, correlation, risk-level comparison, signal combinations
9. Machine Learning Evaluation — Classifier performance, feature importance analysis
10–13. Discussion, Limitations, Future Work & Conclusion — Implications, constraints, and research directions
01. Introduction: Context, Motivation & Research Scope
Artificial intelligence systems are increasingly deployed to support analytical and decision-making tasks. While these systems can extend human capability, they are not infallible. A particularly significant challenge is the tendency of generative models to produce responses that are incorrect, inconsistent, or difficult to interpret—collectively termed hallucinations.
Critically, such errors often do not appear as obvious failures. A response may be fluent and plausible while still demanding careful user scrutiny. This hidden burden reduces the practical value of AI-assisted workflows even when final outputs are eventually correct.
Existing evaluation frameworks primarily measure correctness, with little attention to the cost imposed on users who must validate, interpret, and occasionally correct AI-generated content. This study addresses that gap through a proxy-based framework linking hallucination risk to measurable collaboration effort.
Research Contribution: This work introduces a scalable proxy-based framework that directly links AI hallucination risk to quantified human collaboration effort—without requiring any ground truth validation.
Scale & Platform: 207,862 human–AI interactions analyzed end-to-end using Terno AI's SQL-based analytical engine, enabling full-dataset aggregation without data extraction.
02. Problem Statement: Research Gaps & Core Questions
The increasing adoption of AI in analytical and decision-support roles surfaces two interrelated evaluation challenges. First, most hallucination methods depend on annotated reference data unavailable in production. The relationship between AI output quality and user effort remains underexplored at scale, leaving a critical link in the human–AI collaboration chain unexplored.
Research Question 1: How can hallucination risk be estimated from observable AI response signals, without ground truth?
Research Question 2: How can human collaboration effort be quantified from measurable interaction characteristics?
Research Question 3: What conditions drive the strongest relationship between hallucination risk and user effort?
03. Related Work: Literature, Prior Approaches & Critical Gaps
Hallucination research has concentrated on detection and mitigation using ground truth comparison, intrinsic/extrinsic taxonomies, and automated consistency checks. Multi-stage verification frameworks and RAG-based approaches have advanced the field but retain critical limitations for real-world deployment.
What Exists:
Ground truth–based detection and benchmarking
Intrinsic vs. extrinsic hallucination taxonomies
Automated multi-stage verification frameworks
RAG-based hallucination mitigation pipelines
Domain-specific studies (cybersecurity, healthcare)
Critical Gaps:
Ground truth dependency limits production scalability
Human interaction cost is absent from all frameworks
No unified cross-domain evaluation standard exists
Fluent hallucinations are increasingly hard to detect
Compound effects of co-occurring signals unstudied
Gap this paper closes: Few existing frameworks jointly estimate hallucination risk from observable signals while also quantifying its downstream impact on human effort.
04. Proposed Framework: HRS · CEP · Interaction Classification
The framework operates using observable interaction signals rather than external reference validation and is implemented through Terno AI's SQL-based analytical environment. It consists of two complementary constructs: one estimating hallucination-related response risk, and the other estimating the collaboration effort imposed on users.
Hallucination Risk Score (HRS)
Aggregated proxy estimating the likelihood that an AI response contains potentially unreliable or inconsistent information, derived entirely from internal response characteristics.
Signal Inputs:
Uncertainty Score — hedging language
Vague Score — non-specific phrasing
Contradiction Score — internal inconsistency
High Expansion Flag — unusually large response expansion
HRS = f(uncertainty, vagueness, contradiction, expansion)
Collaboration Effort Proxy (CEP)
Quantifies user interpretation and validation effort using observable structural characteristics of AI responses—no direct behavioral measurement required.
Feature Inputs:
W_AI — AI response word count
W_User — user query word count
L_gap = W_AI − W_User (length differential)
R = W_AI / W_User (expansion ratio)
CEP = f(L_gap, W_AI, W_User, R)
Interaction Classification Thresholds
Risk Levels (based on HRS):
| Category | HRS Threshold |
|---|---|
| Low Risk | HRS ≤ 3 |
| Medium Risk | 3 < HRS ≤ 7 |
| High Risk | HRS > 7 |
Efficiency Groups (based on CEP):
| Category | CEP Threshold |
|---|---|
| Efficient | CEP ≤ 10 |
| Moderate Effort | 10 < CEP ≤ 20 |
| Inefficient | CEP > 20 |
05. System Architecture: Data Layer · Terno AI · Output Generation
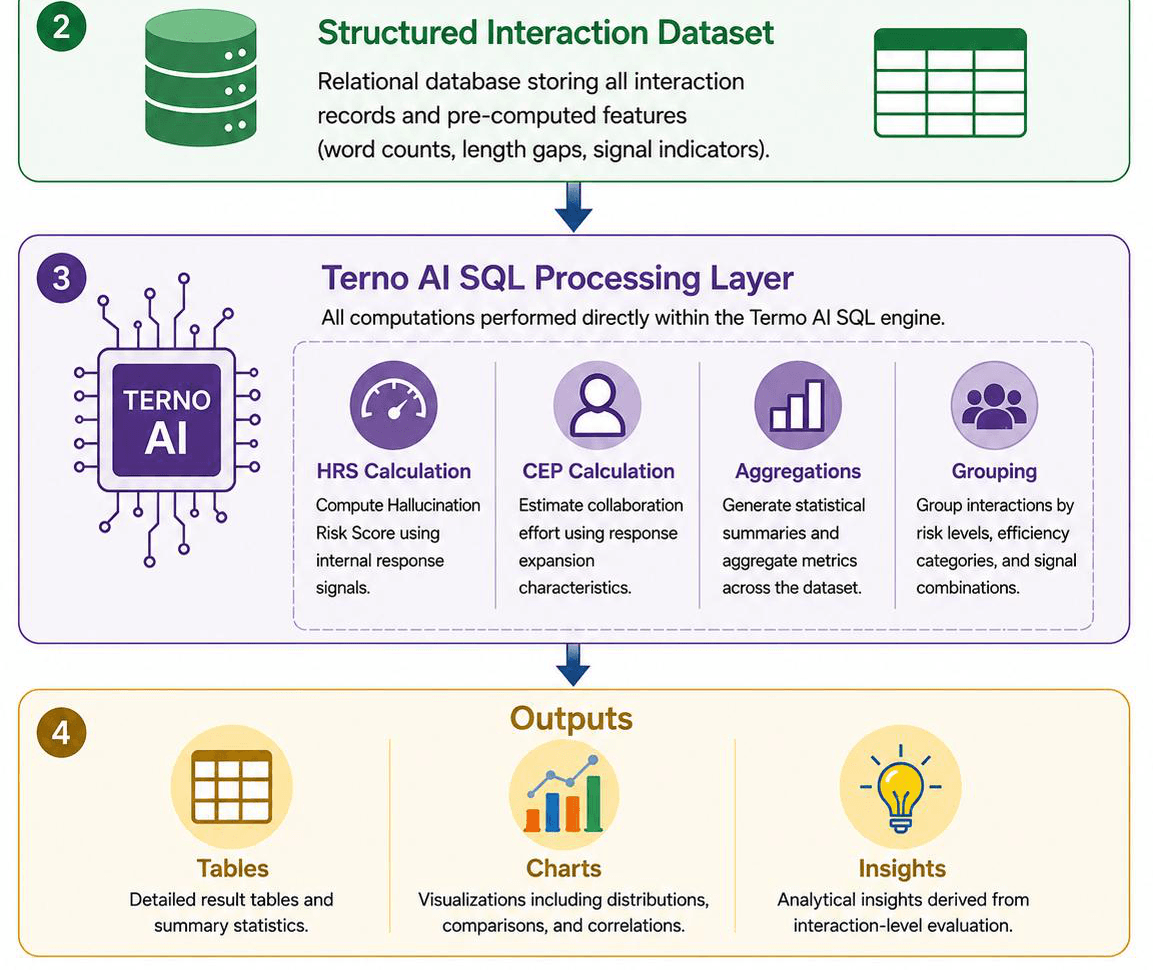
The evaluation system is organized into three integrated layers: data storage and ingestion, analytical processing via Terno AI, and output generation. This design enables scalable computation across 207,862 interaction records entirely within the Terno AI SQL environment—no external data extraction required.
The architecture was designed to support scalable interaction-level analysis without requiring external processing pipelines or manual annotation workflows. By executing aggregation, scoring, and comparative analysis directly within the Terno AI environment, the framework enables efficient full-dataset evaluation at production scale.
Three-layer architecture:
- Data Layer — Structured relational table of 207,862 interactions. Word counts, length gaps, and signal flags pre-computed.
- Processing Layer — Terno AI SQL engine computes HRS, CEP, risk groups, correlations, and signal combinations at full scale.
- Output Layer — Distribution tables, grouped comparisons, bar charts, and correlation summaries generated in-platform.

The end-to-end pipeline moves from raw user–AI interaction data through a structured interaction dataset, into the Terno AI SQL processing layer (which handles HRS calculation, CEP calculation, aggregations, and grouping), and finally produces tables, charts, and insights as outputs.
06. Implementation Details: Feature Engineering · Signal Computation · Analytical Workflow
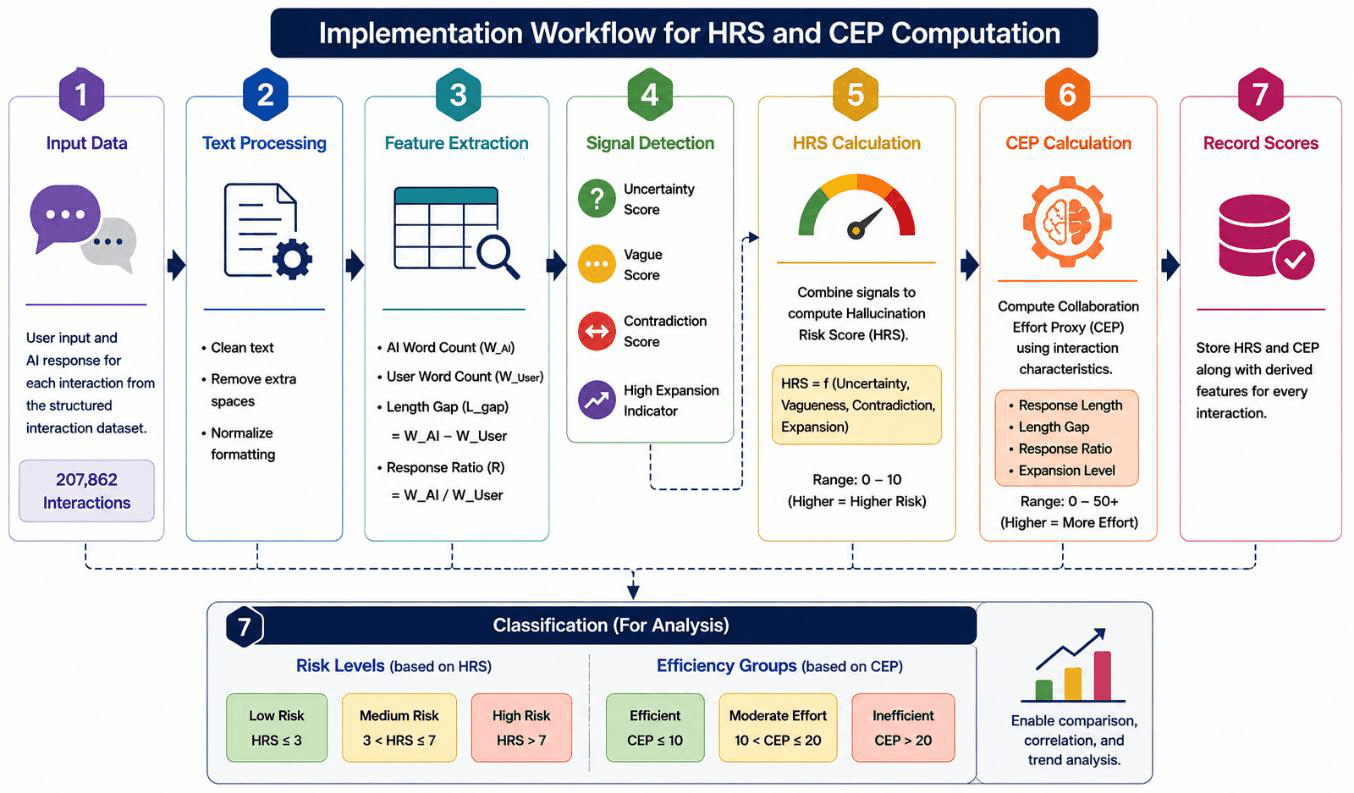
The implementation workflow was executed entirely within the Terno AI analytical environment using structured interaction-level processing and SQL-based aggregation. The framework computes Hallucination Risk Score (HRS) and Collaboration Effort Proxy (CEP) directly from observable response characteristics without requiring external annotation or reference validation.
6.1 Data Source
The analysis is based on 207,862 human–AI interaction records stored within a structured relational dataset. Each interaction contains a user query, an AI-generated response, and derived interaction-level features including word counts, response length differentials, and hallucination-related signal indicators.
6.2 Feature Engineering
AI Word Count (W_AI) — total words in AI response
User Word Count (W_User) — total words in user input
Length Gap (L_gap = W_AI − W_User)
Response Ratio (R = W_AI / W_User)
6.3 Hallucination Risk Signals
Uncertainty Score — hedging or probabilistic language
Vague Score — non-specific or evasive phrasing
Contradiction Score — internal logical inconsistency
High Expansion Indicator — unusually large response expansion
Platform Advantage: All 207,862 interaction records were processed directly within Terno AI using SQL-based aggregation and computation, enabling scalable full-dataset statistical analysis without external data extraction.
07. Use Case Walkthrough: From Raw Interactions to Actionable Insights
This section traces the complete analytical journey from raw interaction data to executive-ready insights, demonstrating the framework's practical deployment using Terno AI across five sequential analytical stages.
- Distribution Analysis — HRS and CEP distributions were computed across the full interaction dataset. Most interactions fall within low-to-medium ranges, while the high-risk tail remains comparatively small but operationally significant.
- Correlation Analysis — Pearson correlation analysis revealed a moderate positive relationship between HRS and CEP, indicating that higher hallucination risk is associated with increased collaboration effort.
- Risk-Level Comparison — Interactions were stratified into low-, medium-, and high-risk categories. CEP, AI word count, and response ratio consistently increased with risk level.
- Efficiency Classification — Interactions were grouped into efficient, moderate-effort, and inefficient categories. Inefficient interactions exhibited substantially longer AI responses and greater interaction imbalance.
- Signal Combination Analysis — Co-occurring uncertainty, contradiction, and high expansion produced the greatest collaboration burden, suggesting multiplicative rather than additive signal effects.
Use Case Outcome: The framework demonstrates that high-risk, high-effort interactions can be identified directly from observable response characteristics, supporting scalable interaction-level evaluation within operational AI environments.
08. Results & Evaluation: Distribution · Correlation · Risk Comparison · Signal Combinations
8.1 Distribution of Hallucination Risk (HRS)
The distribution of Hallucination Risk Scores (HRS) across the interaction dataset is right-skewed, with most interactions concentrated within the low- and medium-risk ranges, while a smaller proportion falls within the high-ri
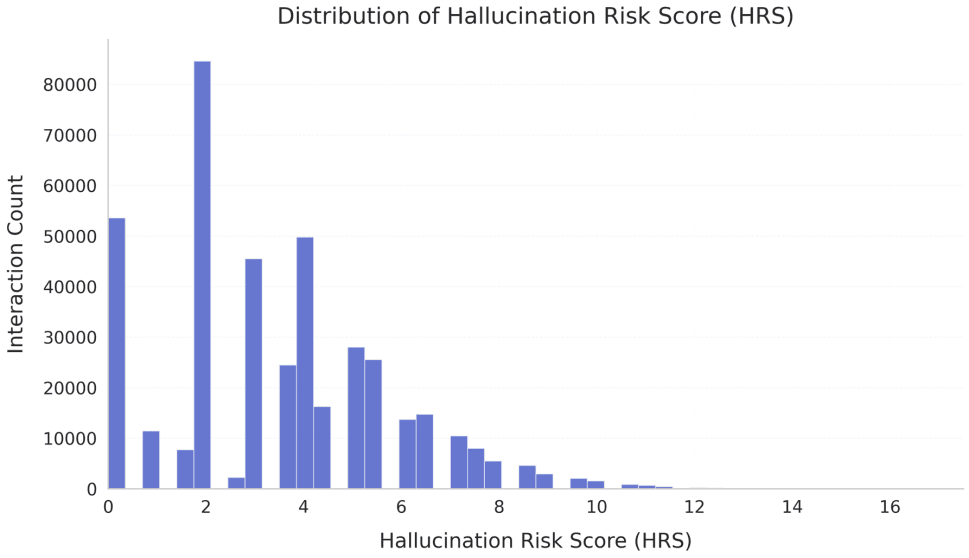
Table I — Hallucination Risk Levels
| Risk Level | HRS Range | Share |
|---|---|---|
| Low Risk | HRS ≤ 3 | 49.36% |
| Medium Risk | 3 < HRS ≤ 7 | 44.05% |
| High Risk | HRS > 7 | 6.59% |
Observation: High-risk interactions exhibited substantially higher average CEP values than low-risk interactions, indicating that a relatively small proportion of interactions contributes disproportionately to collaboration effort.
8.2 Distribution of Collaboration Effort (CEP)
The Collaboration Effort Proxy (CEP) distribution is positively skewed, with most interactions classified as efficient or moderate effort. Only a small proportion of interactions fall into the inefficient category, indicating that high-effort interactions were relatively uncommon but still important for understanding collaboration burden.
Collaboration Effort Distribution
| Category | Share |
|---|---|
| Efficient (CEP ≤ 10) | 68.44% |
| Moderate Effort (10–20) | 28.98% |
| Inefficient (CEP > 20) | 2.58% |
Observation: Most interactions required low-to-moderate collaboration effort, while inefficient interactions represented a small but analytically important subset for examining response expansion and user burden.
8.3 HRS–CEP Correlation
Pearson correlation analysis established a moderate positive relationship between hallucination risk and collaboration effort:
r = 0.40 (p < 0.001, N = 207,862)
The relationship is monotonic but moderately non-linear, suggesting that collaboration effort increases more rapidly at higher HRS levels.
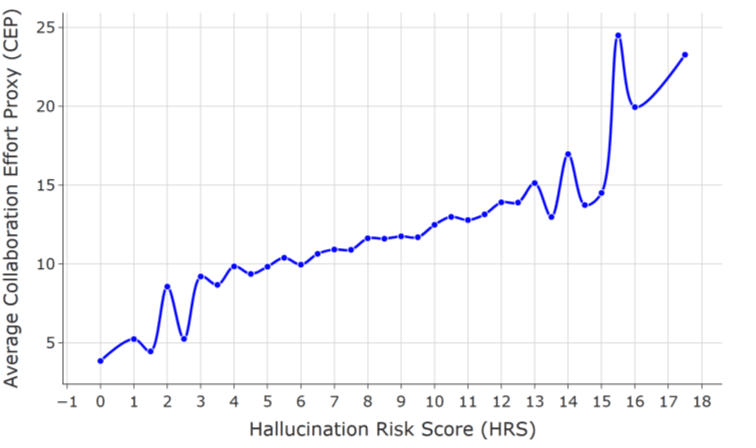
Statistical Note: An r value of 0.40 indicates that hallucination risk explains approximately 16% of the observed variance in collaboration effort. The remaining unexplained variance is likely influenced by additional interaction-level and response-structure characteristics, including response verbosity.
Practical Implication: Managing both hallucination risk and response length is important for reducing collaboration burden, as neither factor alone fully explains interaction inefficiency.
Correlation Strength: r = 0.40 — Moderate positive
8.4 Comparison Across Hallucination Risk Levels
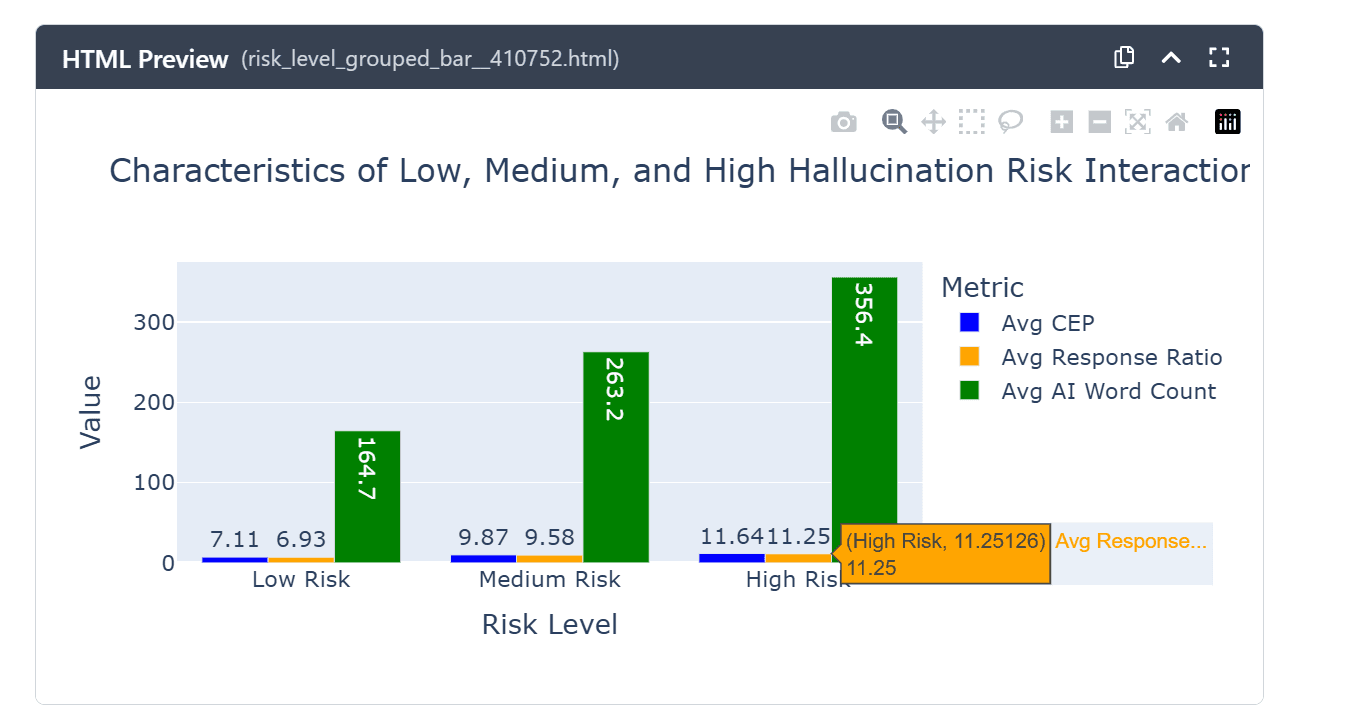
Table II presents three key interaction metrics—average Collaboration Effort Proxy (CEP), AI word count, and response ratio, stratified by hallucination risk level. All three metrics increase consistently from low- to high-risk interactions.
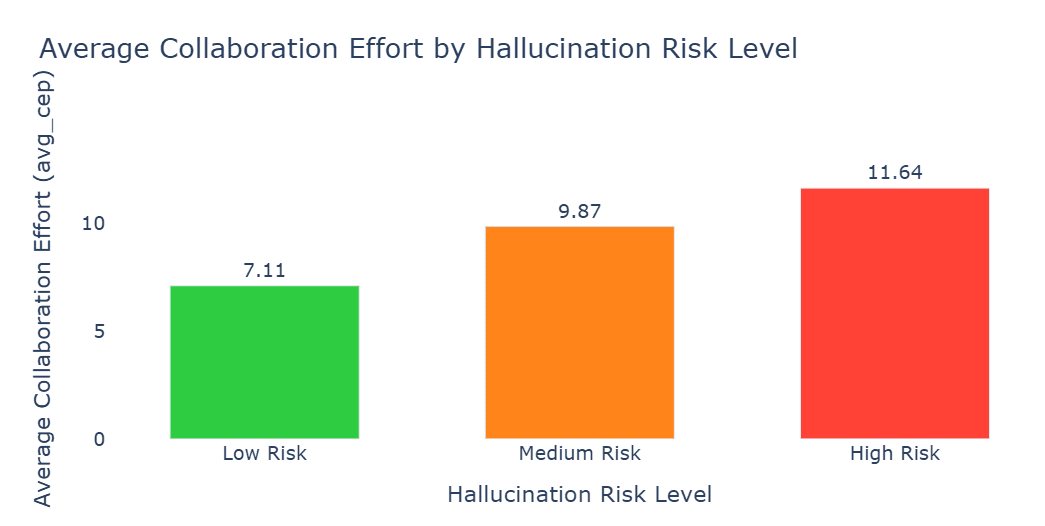
Table II — Interaction Characteristics by Risk Level
| Metric | Low Risk | Medium Risk | High Risk |
|---|---|---|---|
| Avg. Collaboration Effort (CEP) | 7.11 | 9.87 | 11.64 |
| Avg. AI Word Count | 164.7 | 263.2 | 356.4 |
| Avg. Response Ratio | 6.93× | 9.58× | 11.25× |
Key Finding — Response Expansion and Risk: High-risk interactions exhibited substantially longer AI responses than low-risk interactions, with average response length increasing from approximately 165 words to 356 words (116% increase). Higher-risk interactions were also associated with larger response ratios and greater collaboration effort, suggesting a strong relationship between response expansion and interaction inefficiency.
8.5 Interaction Efficiency Analysis
Table III — Efficiency Group Characteristics
| Group | Share | Avg HRS | Avg AI Words |
|---|---|---|---|
| Efficient | 68.44% | 3.07 | 179.6 |
| Moderate Effort | 28.98% | 4.39 | ~350 |
| Inefficient | 2.58% | 5.36 | 505.9 |
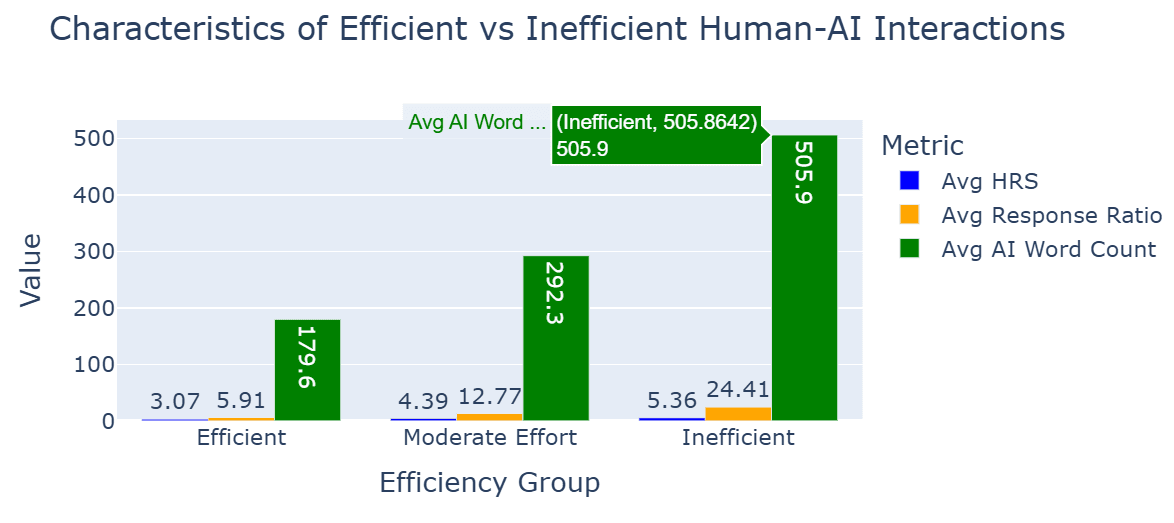
Key Finding — Response Length and Interaction Efficiency: Inefficient interactions exhibited considerably longer AI responses than efficient interactions, with average response length increasing from 179.6 words to 505.9 words (182% increase). These interactions were also associated with higher average HRS values, indicating a relationship between increased response expansion, hallucination risk, and collaboration effort.
Design Implication: The findings suggest that response structure and expansion characteristics may play an important role in collaboration efficiency alongside hallucination-related risk signals.
8.6 Signal Combination Analysis
Signal-combination analysis examined how co-occurring hallucination-related characteristics influence collaboration effort. Interactions containing combinations of uncertainty, contradiction, and high expansion were associated with the highest observed CEP values.
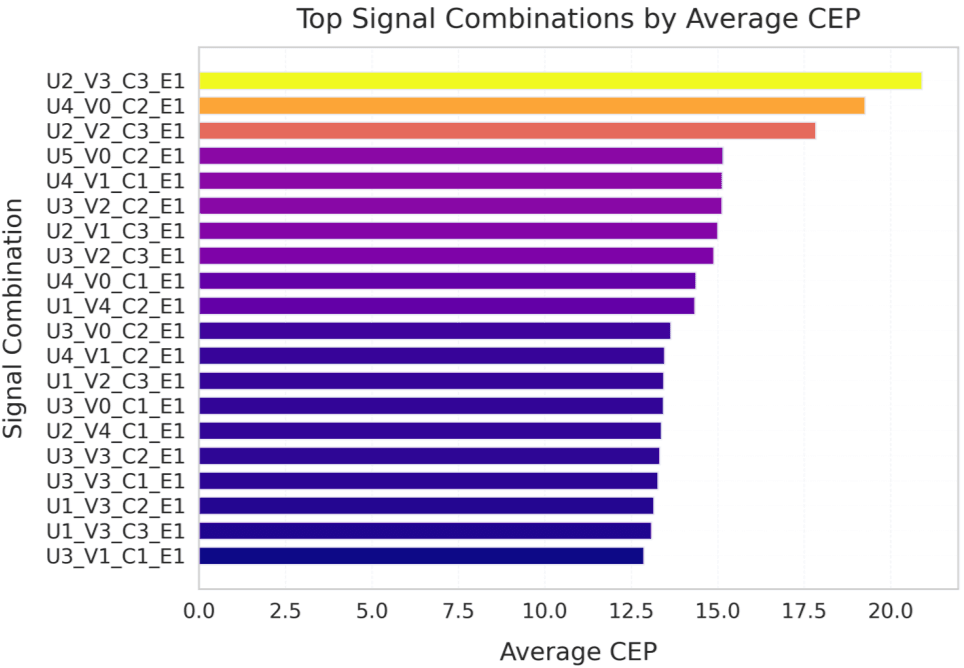
Finding — Compound Signal Effects: Interactions containing multiple co-occurring hallucination-related signals exhibited substantially higher collaboration effort than interactions dominated by isolated signals, suggesting compound interaction effects between uncertainty, contradiction, and response expansion characteristics.
Finding — Contradiction and High Expansion: Signal combinations involving contradiction and high expansion consistently produced among the highest average CEP values across the evaluated interaction groups.
Finding — Response Expansion Across High-Effort Interactions: The high-expansion indicator appeared frequently among the highest-effort interaction combinations, indicating a strong relationship between response expansion characteristics and collaboration burden.
09. Machine Learning Evaluation: Classifier Performance · Feature Importance · Interpretation
Machine learning classifiers were developed to predict interaction efficiency categories and identify which interaction-level features were most strongly associated with inefficient collaboration. Three models were evaluated including Logistic Regression, Random Forest, and XGBoost, using an 80:20 train-test split.
Features Used: HRS, AI word count, user word count, length gap, uncertainty score, vague score, contradiction score, high-expansion indicator.
Target Classes: Efficient (CEP ≤ 10), Moderate Effort (10 < CEP ≤ 20), and Inefficient (CEP > 20).
Evaluation Metrics: Accuracy, macro precision, macro recall, and macro F1. Macro-level metrics were used because the efficiency classes were imbalanced.
9.1 Model Performance
Table IV — Machine Learning Model Performance
| Model | Accuracy | Macro Precision | Macro Recall | Macro F1 |
|---|---|---|---|---|
| Logistic Regression | 0.464 | 0.475 | 0.535 | 0.382 |
| Random Forest | 0.476 | 0.476 | 0.539 | 0.388 |
| XGBoost | 0.685 | 0.489 | 0.340 | 0.291 |
Model Performance Summary: XGBoost achieved the highest overall accuracy (0.685), while Random Forest achieved the highest macro F1 score (0.388). This indicates that XGBoost performed better on overall classification accuracy, whereas Random Forest provided a more balanced performance across the three efficiency classes.
Why Performance Was Moderate: The moderate macro F1 scores suggest that interaction efficiency is difficult to classify cleanly using the selected features. This may reflect overlap between moderate-effort and inefficient interactions, as well as the multifactorial nature of collaboration effort.
9.2 Feature Importance Analysis
| Feature | Importance | Consistent? |
|---|---|---|
| Length Gap (L_gap) | Very High | Yes |
| High Expansion Flag | Very High | Yes |
| AI Word Count (W_AI) | High | Yes |
| User Word Count (W_User) | High | Yes |
| HRS Composite Score | Moderate | Yes |
| Contradiction Score | Low | Partial |
| Uncertainty Score | Low | Partial |
| Vague Score | Low | Partial |
What the Rankings Suggest: Feature-importance results indicate that response-length and expansion-related variables were more influential than isolated hallucination-signal variables. Length gap, high-expansion flag, and AI word count were consistently ranked among the strongest predictors of interaction efficiency.
Core ML Finding: The machine learning results support the broader statistical finding that collaboration inefficiency is associated not only with hallucination-risk signals, but also with response-structure characteristics such as length gap and expansion.
9.3 Interpretation
Hallucination Signals Have Predictive Value: HRS contributed to the classification task, indicating that hallucination-related characteristics contain useful information for identifying inefficient interactions.
Response Expansion Was Strongly Associated With Inefficiency: Length gap, high-expansion flag, and AI word count were consistently important features, suggesting that response verbosity is closely linked to collaboration effort.
Combined Features Provide a More Complete View: The results suggest that efficiency prediction benefits from considering both hallucination-risk indicators and response-behavior features together, rather than relying on linguistic risk signals alone.
10. Discussion: Insights, Implications & Practical Guidance
10.1 Hallucination Risk as a Usability Concern
The moderate positive relationship between hallucination risk and collaboration effort suggests that hallucination-related behavior is not only a factual reliability issue, but also a usability and productivity concern. As hallucination risk increases, users may require additional effort for interpretation, verification, and query reformulation. These findings indicate that evaluation frameworks focused solely on correctness may underestimate the broader interaction cost associated with AI-generated responses.
10.2 The Role of Response Expansion
A major finding of this study is the strong relationship between response expansion characteristics and collaboration inefficiency. Features such as length gap, response ratio, and AI word count consistently showed stronger associations with inefficiency than isolated hallucination-related signals in both statistical and machine learning analyses.
High-risk interactions were associated with substantially longer responses than low-risk interactions, suggesting that increased response expansion may contribute to greater cognitive and interpretive burden for users.
10.3 Compound Effects of Co-Occurring Signals
Signal-combination analysis suggests that co-occurring hallucination-related characteristics may collectively contribute to higher collaboration burden. Interactions involving uncertainty, contradiction, and high expansion consistently exhibited elevated CEP values compared with interactions dominated by isolated signals.
These findings suggest that monitoring combinations of interaction signals may provide additional insight beyond evaluating individual indicators independently.
Practical Implication 1: Response verbosity and expansion characteristics may represent important design considerations for reducing collaboration effort alongside improvements in factual reliability.
Practical Implication 2: Real-time HRS monitoring could support adaptive response strategies such as clarification prompts, confidence indicators, or response-length management for higher-risk interactions.
Practical Implication 3: Evaluation frameworks may benefit from incorporating interaction-effort metrics alongside traditional accuracy-based benchmarks, particularly in conversational AI systems.
Practical Implication 4: Proxy-based evaluation approaches provide a scalable mechanism for interaction-level monitoring in environments where direct ground truth validation is unavailable.
11. Limitations: Scope, Constraints & Interpretive Boundaries
Proxy approximation: Both HRS and CEP are indirect proxy measures and do not directly confirm factual correctness or cognitive workload.
Domain specificity: The dataset reflects a specific conversational environment; interaction dynamics may differ across healthcare, legal, cybersecurity, or other specialized domains.
Feature circularity: Response expansion contributes to both CEP construction and machine learning targets, requiring careful interpretation of feature-importance results.
No behavioral ground truth: No direct behavioral measures—such as correction time, eye-tracking, or user feedback—were available to validate CEP as a cognitive-effort metric.
Verbosity vs. usefulness conflation: The framework cannot fully distinguish unnecessary verbosity from legitimately informative detail; longer responses are not inherently inefficient.
Sampling constraints: Some computationally intensive ML procedures were performed on sampled subsets, while statistical aggregation analyses were conducted on the full interaction dataset.
12. Future Work: Extensions, Enhancements & Research Directions
Behavioral Ground Truth: Integrate behavioral measures such as correction frequency, task completion time, and cognitive-load indicators to further validate CEP as an interaction-effort proxy.
Enhanced Hallucination Detection: Incorporate semantic retrieval verification, external knowledge grounding, and multi-agent consistency evaluation to improve hallucination-risk estimation quality.
Domain Adaptation: Extend the framework to high-stakes domains such as healthcare, legal systems, cybersecurity, and finance using domain-specific risk thresholds and interaction-effort norms.
Real-Time Monitoring: Explore real-time HRS estimation approaches capable of supporting adaptive response strategies such as clarification prompts, confidence indicators, and response-length management.
Advanced ML Models: Investigate transformer-based and sequence-aware models for improved prediction of inefficient conversational interactions.
Multimodal Extension: Extend the framework to multimodal generative AI systems involving text, image, audio, and video interactions.
13. Conclusion: Summary of Contributions & Closing Insights
207,862 interactions analyzed (full dataset via Terno AI) · r = 0.40 risk–effort correlation (p < 0.001) · 116% response length increase (low → high risk) · 182% verbosity gap (inefficient vs. efficient)
This study introduced a scalable proxy-based framework for evaluating hallucination-related response risk and its relationship to human collaboration effort. Applied across 207,862 interactions within the Terno AI analytical environment, the framework demonstrated that hallucination-related response characteristics are associated with measurable increases in collaboration effort, while response expansion characteristics are strongly linked to interaction inefficiency.
The Hallucination Risk Score (HRS) and Collaboration Effort Proxy (CEP) together provide a two-component evaluation framework that captures both response-risk characteristics and interaction-efficiency dynamics. Machine learning evaluation further indicated that combining hallucination-related signals with response-structure features provides a more informative predictive framework than relying on isolated risk indicators alone.
Central Conclusion: The findings suggest that improving AI systems requires attention not only to factual reliability, but also to the efficiency, clarity, and structure of AI-generated responses. Hallucination-related behavior, response expansion, and interaction complexity collectively influence whether AI-generated outputs reduce or increase collaboration burden.
The proxy-based framework presented in this study provides a scalable foundation for evaluating these interaction dynamics in production-scale conversational AI environments without requiring direct ground truth annotation.
References
[1] Z. Ji et al., "A Survey on Hallucination in Natural Language Generation," ACM Computing Surveys, vol. 55, no. 12, pp. 1–38, 2023.
[2] M. Xia et al., "On Hallucinations in Artificial Intelligence–Generated Content," Preprint, 2026.
[3] Y. Bang et al., "HalluLens: LLM Hallucination Benchmark," Preprint, 2025.
[4] A. K. Sood et al., "The Paradigm of Hallucinations in AI-Driven Cybersecurity," ScienceDirect, 2025.
[5] W. Zhang et al., "Hallucination Mitigation for Retrieval-Augmented LLMs," Mathematics, 2025.
[6] "Detecting and Correcting Hallucinations in LLM-Generated Content," Preprint, 2026.
[7] "AI Hallucination Rates and Benchmarks: 2026 Landscape Review," Industry Report, 2026.
[8] Chat # 1: Terno AI — https://neon.app.terno.ai/chat/219786b0-9ccd-4c14-b226-146cc74c3732
[9] Chat # 2: Terno AI — https://neon.app.terno.ai/chat/83386046-7644-4d36-8ee3-1e2cd1da84a6
Terno AI chat share links:
https://neon.app.terno.ai/chat/219786b0-9ccd-4c14-b226-146cc74c3732
https://neon.app.terno.ai/chat/83386046-7644-4d36-8ee3-1e2cd1da84a6
Read the full whitepaper

18 August 2026
The Honest Number Was 83%: Leakage, Abstention, and a Complaint Router You Can Actually Deploy
The same complaint-routing model scores 96.3% or 83.2% depending on which three columns you leave in the training data. The high number is the intake form being read back to you. This is what the leakage audit found before a single model was trained, why 83.2% is the honest figure, and how the same model — given permission to say "I don't know" — becomes deployable at 90.7% accuracy on 79.5% of traffic.

29 July 2026
EdgeGuard: AI-Driven Predictive Maintenance for Power Transformers
Power transformers are among the most critical assets in electrical distribution infrastructure. Their unexpected failure can result in power outages, safety hazards, equipment damage, expensive repairs, and long service interruptions. Traditional transformer maintenance practices often rely on periodic manual inspection, offline testing, or run-to-failure maintenance. These methods are expensive, slow, labor-intensive, and unable to detect rapidly developing faults in real time. EdgeGuard is an AI-driven, edge-computing predictive maintenance system designed to continuously monitor transformer health and forecast failures before catastrophic damage occurs. The system acts as a retrofittable “Digital Doctor” for distribution transformers by combining low-cost industrial sensors, an ESP32 microcontroller, local intelligence, machine learning-based risk prediction, autonomous relay control, and a real-time web dashboard. The proposed system monitors six major transformer health indicators: temperature, humidity, vibration, oil level, current, and voltage. These signals are normalized and processed through a Multi-Layer Perceptron neural network to classify transformer condition and estimate failure risk. If the predicted risk crosses a critical threshold of 80%, EdgeGuard automatically triggers a relay through GPIO 26 to isolate the transformer from the electrical network. The system also supports secure remote control, dashboard monitoring, API-key-based hardware authentication, JWT-based user access, WebSocket live updates, and automatic live-hardware detection. With an estimated deployment cost of approximately ₹3,850, EdgeGuard offers a low-cost alternative to conventional transformer monitoring systems. Its cloud-independent operation and edge-based decision-making make it especially useful for rural and semi-urban distribution grids where connectivity and maintenance resources are limited.

28 July 2026
ANALYZING TOXIC USER BEHAVIOR AND RISK PATTERNS IN ONLINE GAMING PLATFORMS
This study shows that behavioral data alone can't reliably predict gaming toxicity — but a risk-based model combining behavioral and engineered features does a much better job of flagging the small segment of high-risk users driving disproportionate harm.