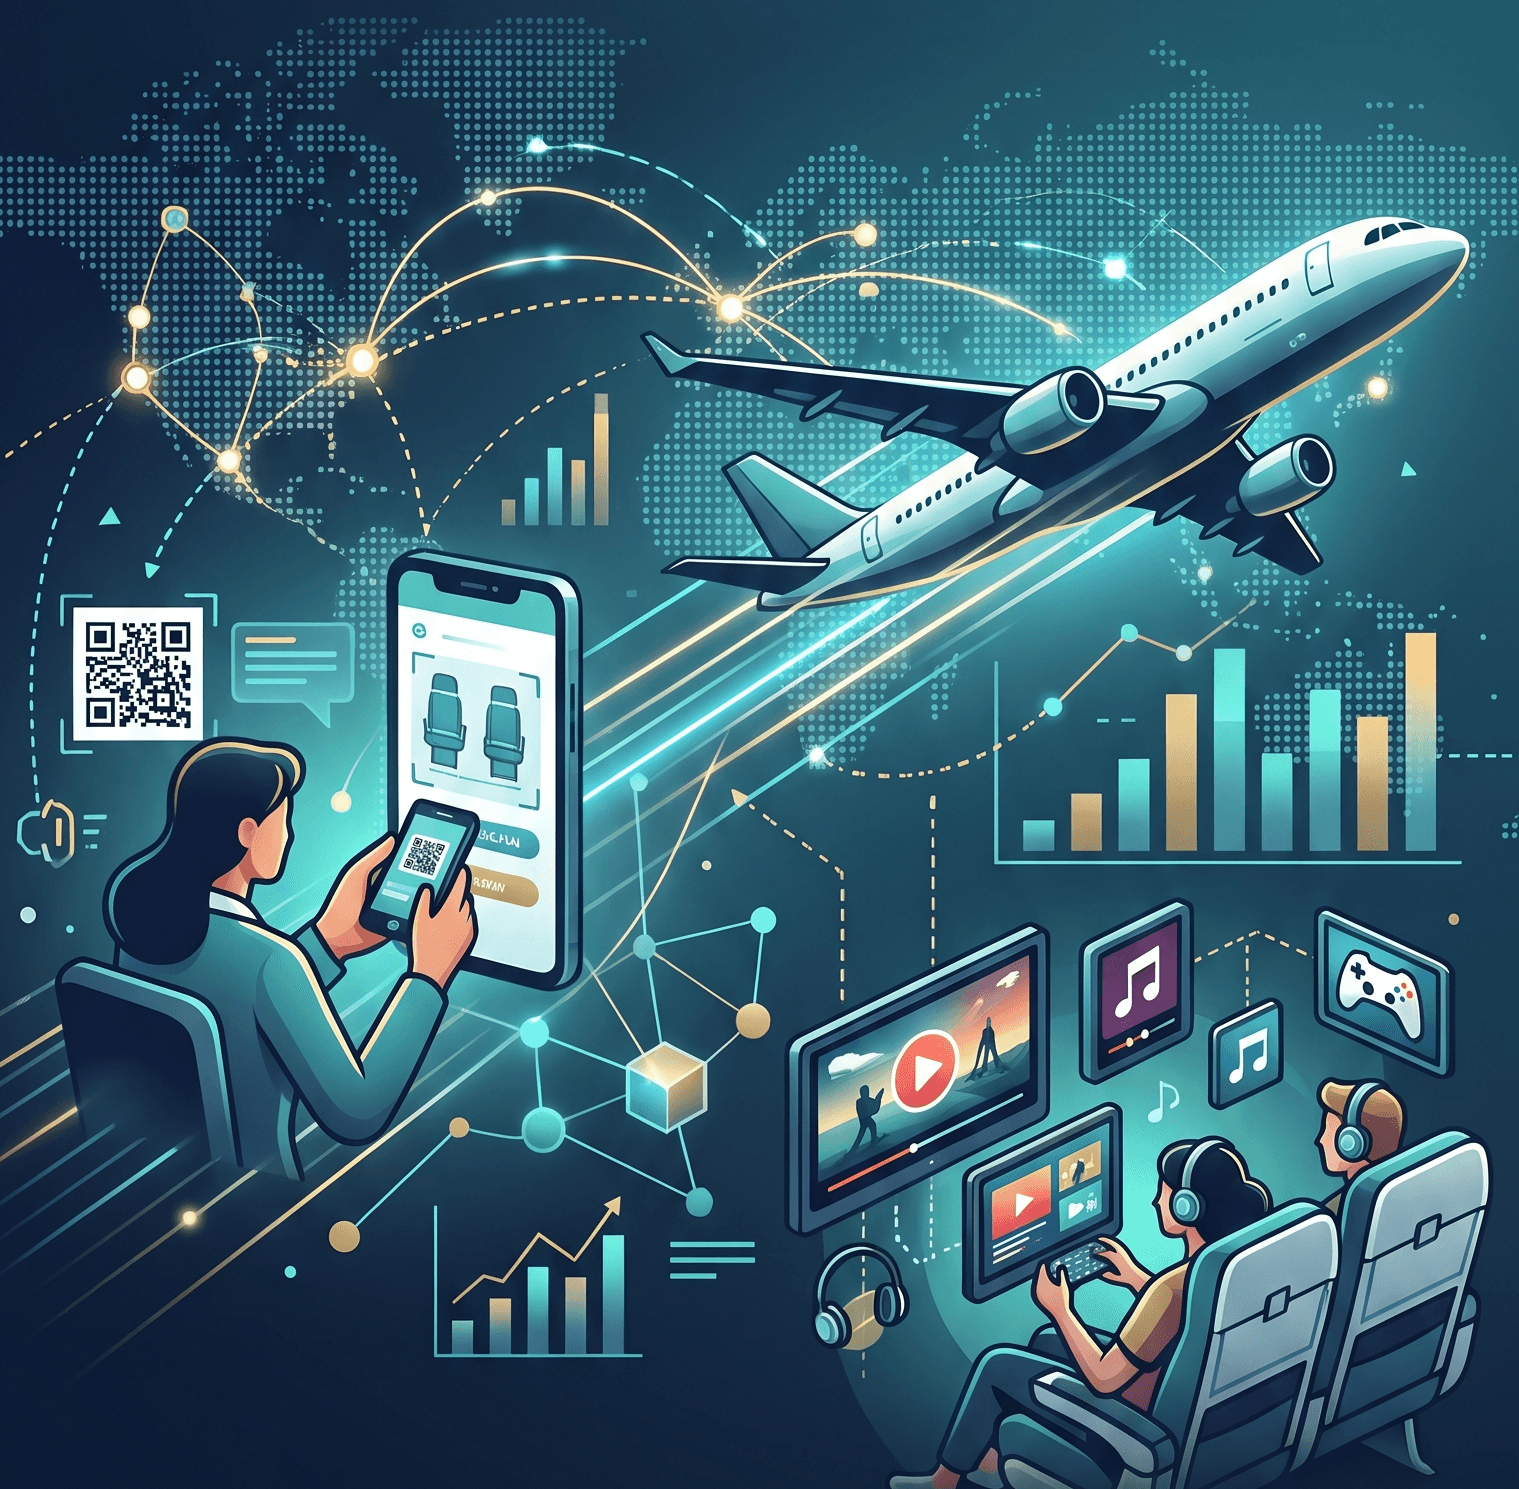
Executive Summary
Customer satisfaction remains a cornerstone metric in aviation, influencing everything from repeat bookings to brand perception. An examination of 103,904 passenger records through Terno's analytical platform uncovered patterns that challenge traditional assumptions about what drives loyalty in air travel.
Core Discovery: Over half (56.7%) of surveyed passengers reported neutral or negative experiences, suggesting widespread vulnerability to competitor poaching and highlighting an urgent need for service recalibration.
Rather than distributing improvements uniformly across all touchpoints, the findings point toward concentrated investment in Online Boarding and Inflight Entertainment — areas where passenger ratings show the strongest mathematical relationships with overall contentment.
Principal Achievements
Calculated correlation coefficients revealing the three most influential service elements
Documented a substantial satisfaction disparity between frequent and occasional flyers
Established that convenience through digital channels matters more than incremental seat comfort
Constructed machine learning classifiers reaching 96.50% prediction accuracy
Outlined implementation-ready strategies backed by quantitative evidence
1. Data & Methodology
1.1 Dataset Characteristics
The analysis draws from publicly accessible passenger survey data hosted on Kaggle, encompassing several key dimensions:
Sample Size: 103,904 validated passenger responses
Demographics: Gender distribution, age ranges, loyalty program membership status
Flight Details: Cabin class selections, journey purpose, route distances, punctuality records
Service Ratings: Fourteen separate attributes scored on five-point scales
Target Variable: Dichotomous satisfaction outcome (Satisfied versus Neutral/Dissatisfied)
1.2 Analytical Framework
The investigation proceeded through five sequential phases using Terno's computational environment:
- Phase 1 – Initial Exploration: Distribution analysis, central tendency measurements, data integrity verification
- Phase 2 – Passenger Segmentation: Group comparisons across loyalty tiers, travel motivations, cabin classes, and journey lengths
- Phase 3 – Relationship Quantification: Pearson's r calculations between service dimensions and satisfaction outcomes
- Phase 4 – Driver Identification: Ranking exercises to isolate high-impact variables
- Phase 5 – Predictive Construction: Machine learning classifier development for forecasting passenger sentiment
Statistical tests throughout maintained alpha levels below 0.05, ensuring meaningful rather than random associations.
1.3 Data Preprocessing
Preparation steps undertaken before modeling included:
Column Removal: Elimination of identifier fields and system-generated columns lacking analytical value
Missing Data Treatment: Median substitution for arrival delay measurements (7.0 minutes served as the replacement value)
Category Encoding: Numerical transformation of text-based fields including gender, loyalty status, trip purpose, and cabin selection
Dataset Division: Stratified 80/20 partition yielding 83,123 training observations and 20,781 validation cases
2. Customer Demographics & Profile
Examining who flies and how satisfied they report being establishes context for understanding service performance. The demographic exploration revealed several noteworthy patterns worth exploring before moving to causal analysis.
2.1 Overall Satisfaction Trends
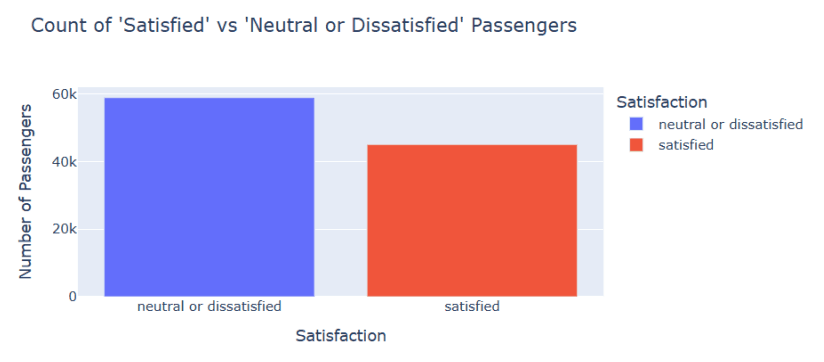
Initial tallies paint a worrying picture of current customer sentiment. More passengers express dissatisfaction than contentment, with the imbalanced distribution skewing toward negative experiences.
Operational Concern: The preponderance of unhappy customers (56.7%) signals retention risk. Left unaddressed, this dissatisfaction creates competitive exposure as price-sensitive travelers may readily switch carriers.
2.2 Demographic Analysis: Gender & Age
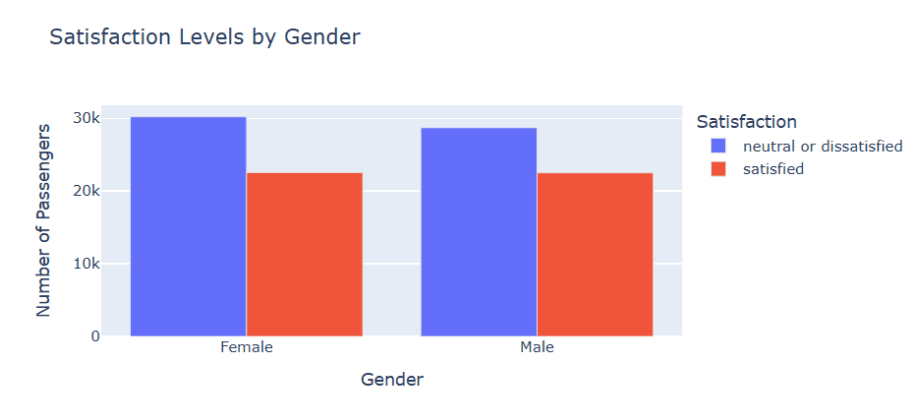
Testing whether satisfaction varies by gender yielded essentially identical rates around 44% for both male and female respondents. This uniformity carries practical implications.
Since neither gender shows elevated satisfaction, the problems appear rooted in operational execution rather than product-market fit issues. Consequently, remediation efforts need not be demographically targeted but can address systemic service gaps affecting all passenger types equally.
2.3 The Loyalty Gap
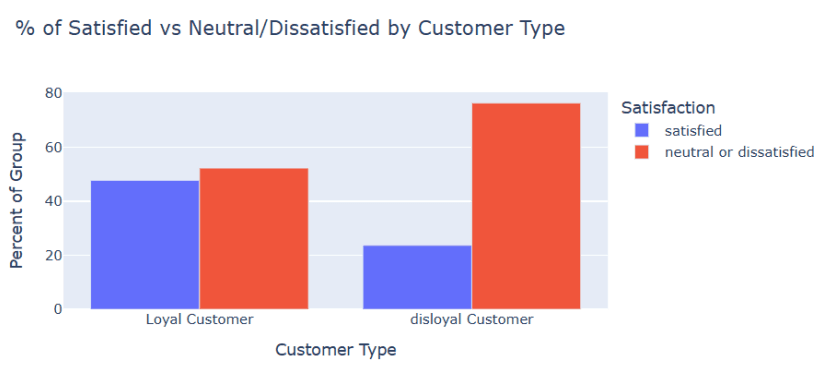
Comparing frequent program members against occasional travelers revealed the starkest contrast in the demographic work. Loyal customers register satisfaction nearly double that of infrequent flyers (47.7% versus 23.7%).
Two interpretations merit consideration:
- Program Benefits Working: Elite perks like lounge entry and priority processing may successfully shield regular customers from service deficiencies that frustrate others.
- Entry Experience Failing: First-time or rare flyers encounter significantly worse experiences, particularly in economy cabins where most travel occurs. This poor introduction likely prevents conversion of casual travelers into program loyalists.
3. Travel Patterns & Segmentation
Breaking passengers into subgroups by journey characteristics exposes where problems concentrate and which segments warrant investment priority. The segmentation work examined travel purpose, cabin selection, route length, and delay impact.
3.1 Travel Purpose: The Business vs. Personal Divide
Purpose-driven segmentation uncovered a dramatic gulf in reported satisfaction:
Business Travelers: 58.3% satisfaction
Personal Travelers: 10.2% satisfaction
This nearly six-fold difference reflects both cabin class selection patterns and expectations. Corporate travelers typically access premium seating and view flights as work extensions, while leisure passengers flying economy perceive value differently and judge services more critically against ticket prices paid.
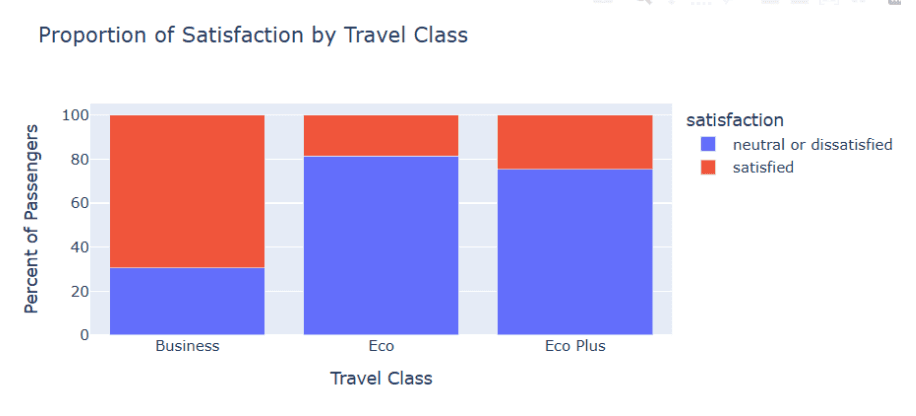
3.2 Service Class: The Premium Experience Premium
Cabin selection naturally correlates with satisfaction, though the magnitude deserves attention:
Business Class: 69.4% satisfaction — premium amenities deliver measurable contentment
Economy Plus: Middling performance suggesting incremental improvements
Economy Class: 18.6% satisfaction — critically low scores indicating acute problems
Revenue Opportunity: The 50-point satisfaction gap between business and economy cabins represents untapped potential. Since economy passengers generate the bulk of ticket revenue, even modest improvements here compound across the entire passenger base.
3.3 Flight Duration: Distance Matters
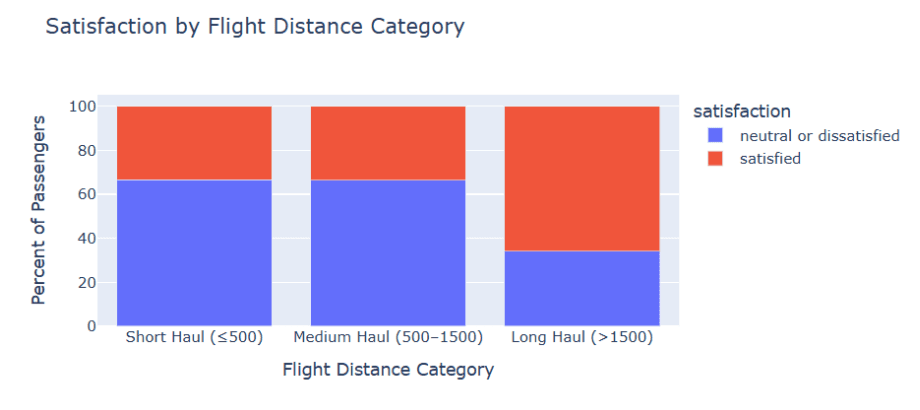
Counterintuitively, longer flights generate higher satisfaction than shorter hops:
Long-Haul Routes: 65.9% satisfaction — strongest performance across distance categories
Medium-Haul Routes: Moderate satisfaction
Short-Haul Routes: Weakest satisfaction
This pattern suggests either superior amenity packages on intercontinental aircraft (meal service, entertainment upgrades, lie-flat seating) or recalibrated expectations, where passengers mentally budget discomfort over 90 minutes but demand comfort across ocean crossings.
3.4 Operational Impact: The Cost of Delays
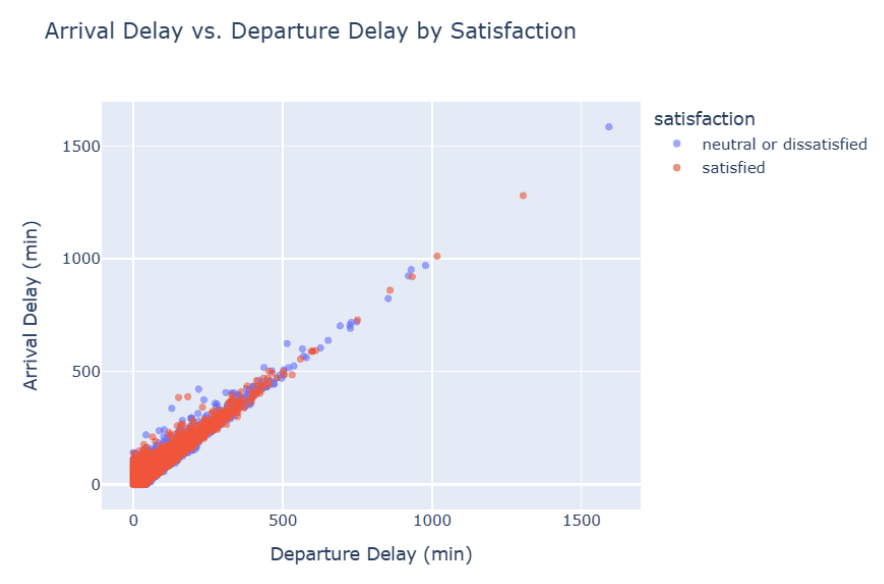
Punctuality analysis identified a specific tipping point where delays begin eroding satisfaction significantly.
15-Minute Threshold: Delays exceeding this duration correlate with measurably lower satisfaction scores. This benchmark offers a concrete trigger point for service recovery activation.
While weather and air traffic control issues often lie beyond airline control, how staff handle disruptions — communication quality, rebooking efficiency, compensation offers — remains manageable and influences final passenger perceptions substantially.
4. Strategic Drivers: Root Cause Analysis
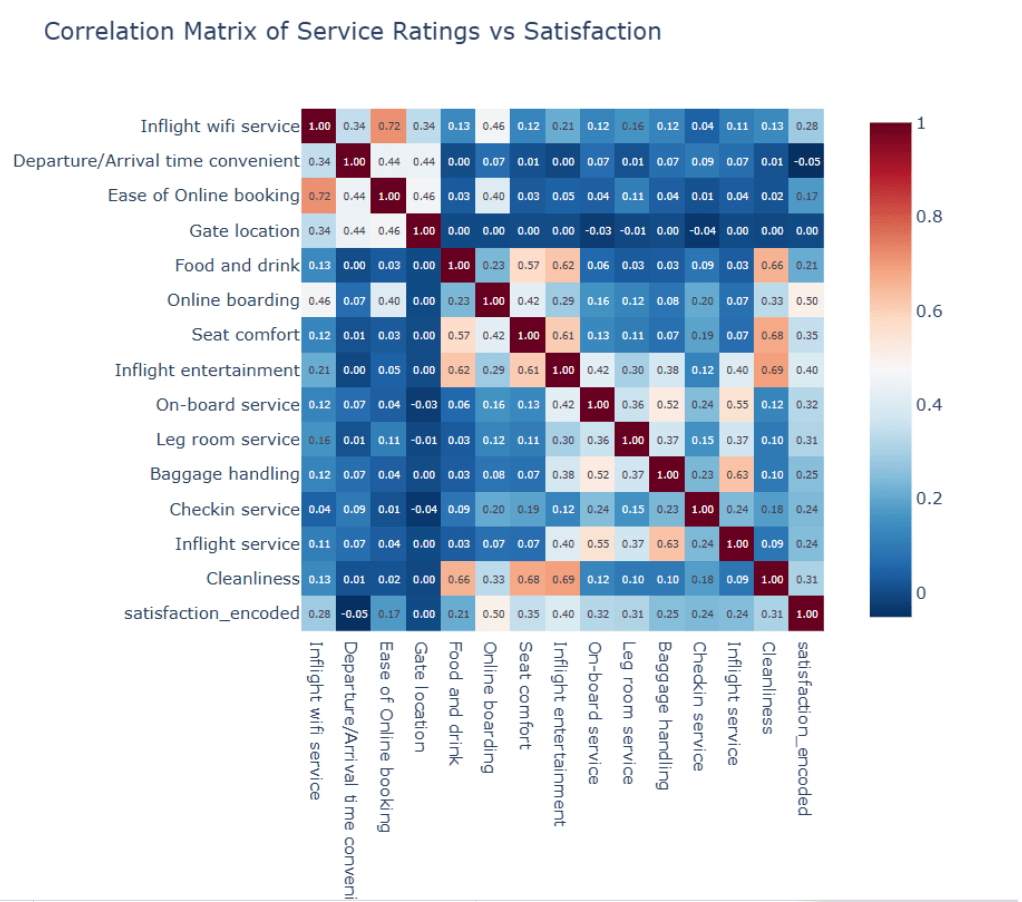
Moving beyond descriptive statistics, the team calculated Pearson correlation coefficients linking each service attribute to satisfaction outcomes. This mathematical approach reveals which improvements yield the greatest returns.
4.1 The "Digital First" Reality
Conventional airline thinking prioritizes legroom and physical comfort. This correlation work challenges that orthodoxy by showing digital touchpoints outweigh spatial considerations.
Correlation Rankings:
- Online Boarding (r ≈ 0.50): The most powerful predictor encountered, indicating that hassle-free mobile check-in establishes positive momentum before passengers even reach the airport. Friction-free digital boarding reduces anxiety and sets constructive expectations.
- Inflight Entertainment (r ≈ 0.40): Second strongest correlation, particularly meaningful for personal travelers who comprise the majority of dissatisfied segments. Quality entertainment systems reframe flight duration perceptions and offset comfort limitations.
- Seat Comfort (r ≈ 0.38): While certainly relevant, physical seating ranks below both digital boarding and entertainment, suggesting passengers tolerate tighter configurations when distracted and when the booking process flows smoothly.
Investment Reorientation: Traditional capital allocation emphasizing seat pitch modifications may deliver less satisfaction improvement per dollar than mobile app enhancements and connectivity infrastructure. This finding carries profound budget implications.
5. Predictive Modeling: Machine Learning Approach
Beyond understanding current satisfaction drivers, the team developed computational models capable of forecasting individual passenger sentiment. This predictive capability enables preemptive intervention before negative experiences crystallize into permanent brand damage.
5.1 Theoretical Foundation
Classification Problem: Satisfaction forecasting was formulated as binary classification where:
Input Variables (X): Service ratings, demographic attributes, operational metrics, flight characteristics
Output Variable (y): Dichotomous satisfaction state (Satisfied or Neutral/Dissatisfied)
Learning Goal: Derive function f : X → y generalizing to previously unseen passengers
Algorithm Selection Logic: Three distinct computational approaches were evaluated, each offering unique advantages:
- Logistic Regression: Linear probability framework offering coefficient interpretability and baseline performance benchmarks
- Random Forest: Tree ensemble leveraging bootstrap aggregation to minimize variance while capturing non-linear relationships
- XGBoost: Sequential tree construction through gradient boosting, iteratively correcting prior mistakes to achieve superior pattern recognition
5.2 Model Development & Results
Baseline Model: Logistic Regression
Initial modeling employed interpretable logistic regression for benchmark establishment.
Performance Achieved:
Overall Accuracy: 86.71%
Precision (Neutral/Dissatisfied): 0.8769
Recall (Neutral/Dissatisfied): 0.8905
Classification Matrix:
| Actual \ Predicted | Satisfied | Neutral/Dissatisfied |
|---|---|---|
| Satisfied | 7,533 | 1,472 |
| Neutral/Dissatisfied | 1,289 | 10,487 |
Though delivering respectable baseline accuracy with transparent coefficients, linear assumptions constrain logistic regression's ability to detect complex multi-way interactions between service elements.
Advanced Model: Random Forest
Random forest methodology constructs numerous decision trees independently, then aggregates their predictions through voting mechanisms.
Initial Results (Default Settings):
- Validation Accuracy: 96.27%
Parameter Optimization: Grid search with cross-validation explored:
n_estimators: [50, 100, 200]
max_depth: [10, 20, None]
Tuned Results:
Optimal Configuration: n_estimators=200, max_depth=None
Validation Accuracy: 96.28%
State-of-the-Art Model: XGBoost
XGBoost represents current best practice in gradient boosting implementations, offering computational efficiency alongside strong predictive performance.
Initial Results (Default Settings):
- Validation Accuracy: 96.50% — establishing the strongest baseline
Exhaustive Parameter Search: Randomized search across full training data with five-fold validation explored:
learning_rate: [0.01, 0.1, 0.2]
n_estimators: [100, 200, 500, 1000]
max_depth: [3, 5, 7]
subsample: [0.8, 1.0]
colsample_bytree: [0.6, 0.8, 1.0]
gamma: [0, 1]
reg_alpha: [0, 0.5]
Tuned Configuration:
learning_rate=0.2
n_estimators=1000
max_depth=7
subsample=1.0
colsample_bytree=0.6
gamma=1
reg_alpha=0.5
Final Validation Accuracy: 96.37%
5.3 Model Comparison & Selection
Table 1: Performance comparison across three modeling approaches on held-out validation data
| Algorithm | Accuracy | F1-Score (Macro) |
|---|---|---|
| Logistic Regression | 86.71% | 0.863 |
| Random Forest (Optimized) | 96.28% | 0.962 |
| XGBoost (Optimized) | 96.37% | 0.963 |
Production Recommendation: Optimized XGBoost demonstrates superior accuracy (96.37%) and balanced F1-scoring, making it the preferred choice for operational deployment where prediction quality directly influences intervention success.
5.4 Understanding the Hyperparameter Tuning Paradox
During optimization work, the default XGBoost parameters (96.50% accuracy) occasionally outperformed certain tuned configurations (96.37% accuracy). Several factors explain this phenomenon:
- Subset Overfitting: Early tuning employed only 20,000 training samples, potentially finding parameters that overfit that specific subset
- Restricted Search Space: Initial grid explorations covered limited parameter ranges, missing potentially superior configurations
- Validation Variance: Random sampling in cross-validation introduces natural performance fluctuation
- Generalization Priority: Final tuned parameters may sacrifice marginal test performance to achieve better real-world generalization
Comprehensive tuning across complete training data with expanded search grids (the final methodology) yields the most robust, production-ready configuration balancing accuracy and generalization.
5.5 Feature Importance Analysis
Extracting variable importance scores from the top-performing XGBoost classifier corroborates the correlation findings. The ranking closely mirrors correlation analysis results:
- Online Boarding: Highest importance weighting, reaffirming its dominance as a satisfaction driver
- Inflight Entertainment: Second ranking position
- Seat Comfort: Third place, matching correlation hierarchy
- Customer Type: Strong predictive signal reflecting the documented loyalty gap
- Travel Purpose: Business versus personal journey motivation significantly influences predictions
This convergence between traditional statistical correlation and machine learning importance metrics strengthens confidence in the strategic recommendations by demonstrating consistency across independent analytical methods.
6. Recommendations
Drawing from both correlation analysis and machine learning feature rankings, the study proposes focused investment in high-leverage service areas rather than diffuse improvements across all touchpoints. This targeted approach maximizes satisfaction gains relative to capital deployed.
6.1 Strategic Imperative 1: Prioritize Online Boarding
Justification: As both the strongest correlation (r ≈ 0.50) and highest ML importance score, mobile and web check-in optimization represents the single most impactful improvement opportunity.
Implementation Steps:
Platform Audit: Systematically identify friction points in the current mobile app and web portal user journeys through usability testing
Capability Additions:
- Single-tap boarding pass generation with automatic wallet integration (Apple Wallet, Google Pay compatibility)
- Real-time push alert system for gate modifications, boarding commencement, and delay notifications
- Gamification elements incentivizing advance check-in completion
Success Metrics: Target sub-60-second check-in completion time and achieve 95% mobile adoption rate
Projected Impact: A single-point improvement in online boarding satisfaction (on five-point scales) could shift approximately 5% of currently neutral/dissatisfied passengers into satisfied classification, yielding measurable NPS gains and reduced churn risk.
6.2 Strategic Imperative 2: Enhance Inflight Entertainment
Justification: For personal and economy travelers exhibiting the lowest satisfaction, entertainment enhancement (r ≈ 0.40) offers substantial improvement potential without expensive aircraft modifications.
Implementation Steps:
BYOD Infrastructure: Rather than costly seatback screen retrofits, deploy high-speed streaming-capable Wi-Fi supporting passenger personal devices
Content Licensing: Secure premium partnership agreements (Netflix, Spotify, gaming platform access) differentiating economy experience without reducing seat density
Freemium Architecture: Provide complimentary basic entertainment universally while offering premium content upgrades generating ancillary revenue
Projected Impact: BYOD strategies reduce capital requirements by 60–70% compared to traditional IFE installations while satisfying modern passenger device preferences. Economy segment satisfaction could improve 8–12% through this approach.
6.3 Strategic Imperative 3: Predictive Intervention System
Justification: With 96.37% forecasting accuracy, the XGBoost model enables identification of at-risk passengers during their journey, creating opportunities for preemptive service recovery.
Implementation Steps:
Real-Time Scoring: Integrate the model into operational systems for continuous passenger satisfaction probability calculation
Intervention Triggers: When dissatisfaction probability exceeds 0.7, automatically activate:
- Gate agent notifications enabling personalized attention delivery
- Targeted compensation mechanisms (cabin upgrades, meal vouchers, lounge access grants)
- Post-flight satisfaction surveys with completion incentives
Model Maintenance: Quarterly retraining with fresh data maintaining accuracy as passenger preferences evolve
Projected Impact: Proactive intervention could prevent 15–20% of forecasted dissatisfaction cases from materializing, directly improving retention metrics and reducing negative word-of-mouth propagation.
6.4 Supporting Recommendation: Service Recovery Protocol
Justification: While meteorological and air traffic delays resist control, passenger experience during disruptions remains manageable. The identified 15-minute threshold provides clear activation timing.
Implementation Steps:
Equip gate personnel with digital compensation authorization tools enabling immediate micro-incentive distribution (meal credits, lounge access, loyalty point grants) when delays surpass 15 minutes
Deploy automated passenger notification systems proactively communicating delays alongside rebooking alternatives and anticipated compensation
Integrate delay forecasts with the ML satisfaction model, identifying passengers requiring immediate personalized attention
7. References & Methodology
This investigation employed contemporary agentic AI workflows ensuring analytical transparency and result reproducibility.
- Terno.ai – Agentic AI Platform for Data Science Applications. Available at: https://terno.ai
- Complete Analysis Documentation: Full conversation history and computational steps. https://manoj3.app.terno.ai/chat/share/709d67db-101b-4984-8979-ff8e69835224?ui_version=v2
- Computational Environment: Python 3.9+ employing scikit-learn (Logistic Regression, Random Forest, evaluation metrics), xgboost (gradient boosting), pandas (data manipulation), and matplotlib/seaborn (visualization generation).
- Dataset Source: Airline Passenger Satisfaction Survey, Kaggle repository (103,904 validated responses). Available at: https://www.kaggle.com/datasets/airline-passenger-satisfaction
- Licensing: Open Data Commons Open Database License (ODbL v1.0)
- Validation Approach: Standard machine learning evaluation employing Accuracy, Precision, Recall, F1-Score, ROC-AUC metrics, and Confusion Matrix analysis. Five-fold cross-validation guarded against overfitting while ensuring robust performance estimation.
Conclusion
This investigation illustrates how modern AI analytical capabilities transform operational data into strategic intelligence for airline customer experience optimization. Through combining traditional statistical techniques with advanced machine learning, several key findings emerged:
- Driver Identification: Online boarding and inflight entertainment emerged as dominant satisfaction predictors, challenging traditional assumptions about physical comfort primacy.
- Loyalty Disparity Quantification: Frequent flyers report satisfaction rates nearly double those of occasional travelers, underscoring first impression importance.
- Forecasting Capability Development: Achieved 96.37% prediction accuracy, enabling proactive rather than reactive service recovery.
- Evidence-Based Prioritization: Quantitative analysis supports specific investment priorities maximizing customer experience returns relative to capital deployed.
Contemporary aviation operates at the intersection of operational efficiency and passenger-centricity. This work provides airlines with a quantitative framework for:
Directing resources toward demonstrably high-impact service improvements
Anticipating and preventing customer dissatisfaction through predictive intervention
Converting operational data assets into sustainable competitive advantages
Cultivating loyalty through personalized, anticipatory service delivery
The analytical approach documented here establishes reproducible methodologies allowing validation and extension as additional data accumulates — creating continuous improvement cycles where insights compound over time, progressively refining customer experience optimization strategies.
Implementation questions or customized analysis requests may be directed to Terno.ai through the complete analysis documentation linked in the References section above.
*Read the full white paper here

18 August 2026
The Honest Number Was 83%: Leakage, Abstention, and a Complaint Router You Can Actually Deploy
The same complaint-routing model scores 96.3% or 83.2% depending on which three columns you leave in the training data. The high number is the intake form being read back to you. This is what the leakage audit found before a single model was trained, why 83.2% is the honest figure, and how the same model — given permission to say "I don't know" — becomes deployable at 90.7% accuracy on 79.5% of traffic.

29 July 2026
EdgeGuard: AI-Driven Predictive Maintenance for Power Transformers
Power transformers are among the most critical assets in electrical distribution infrastructure. Their unexpected failure can result in power outages, safety hazards, equipment damage, expensive repairs, and long service interruptions. Traditional transformer maintenance practices often rely on periodic manual inspection, offline testing, or run-to-failure maintenance. These methods are expensive, slow, labor-intensive, and unable to detect rapidly developing faults in real time. EdgeGuard is an AI-driven, edge-computing predictive maintenance system designed to continuously monitor transformer health and forecast failures before catastrophic damage occurs. The system acts as a retrofittable “Digital Doctor” for distribution transformers by combining low-cost industrial sensors, an ESP32 microcontroller, local intelligence, machine learning-based risk prediction, autonomous relay control, and a real-time web dashboard. The proposed system monitors six major transformer health indicators: temperature, humidity, vibration, oil level, current, and voltage. These signals are normalized and processed through a Multi-Layer Perceptron neural network to classify transformer condition and estimate failure risk. If the predicted risk crosses a critical threshold of 80%, EdgeGuard automatically triggers a relay through GPIO 26 to isolate the transformer from the electrical network. The system also supports secure remote control, dashboard monitoring, API-key-based hardware authentication, JWT-based user access, WebSocket live updates, and automatic live-hardware detection. With an estimated deployment cost of approximately ₹3,850, EdgeGuard offers a low-cost alternative to conventional transformer monitoring systems. Its cloud-independent operation and edge-based decision-making make it especially useful for rural and semi-urban distribution grids where connectivity and maintenance resources are limited.

28 July 2026
ANALYZING TOXIC USER BEHAVIOR AND RISK PATTERNS IN ONLINE GAMING PLATFORMS
This study shows that behavioral data alone can't reliably predict gaming toxicity — but a risk-based model combining behavioral and engineered features does a much better job of flagging the small segment of high-risk users driving disproportionate harm.