Nobody Had to Label It
Every government publishes decisions continuously. A department sets a scholarship rate, then revises it eighteen months later. It fixes an eligibility cut-off, then partially relaxes it for one district. It cancels a scheme, then reinstates a version of it under a different name.
Each of those documents is written as though it stands alone. In practice they overwrite each other, and the overwriting is not tracked anywhere central. Somebody applying for that scholarship — or an officer deciding whether to approve it — has to know which of five documents is currently operative.
This paper is about finding those collisions at scale, in a corpus of roughly 12,300 government resolutions. The method is deliberately unglamorous, and that is the point.
The Obvious Approach, and Why We Abandoned It
The natural framing is a classification problem. Take two clauses, feed both to a model, ask whether they contradict each other. It is a well-studied task with well-studied architectures.
It also needs labelled examples, and no government publishes a register of its own contradictions. The standard workaround is to generate them: prompt a large language model to write clause pairs and tag each one as contradictory, consistent, or unrelated.
We had such a dataset — several thousand generated pairs — and abandoned it. Two reasons, and the second matters more than the first.
The labels carry a known error rate. In the version we held, the generating model agreed with its own labels far more readily than trained reviewers did. A model trained on it learns the label generator's habits as much as the underlying phenomenon.
A single metadata column nearly gave the answer away. One field describing the type of conflict was populated only for contradictory pairs. A rule reading that one column and ignoring the clause text entirely scored roughly twice the random baseline. Any headline number from that dataset would have been measuring the generator's bookkeeping, not the reasoning.
That is a familiar failure to anyone who has read the earlier papers in this series. It was the deciding factor.
What the Documents Already Say
Here is the observation the whole paper rests on.
These documents are not free prose. They follow a bureaucratic template that has barely changed in decades. Each one carries its own departmental reference number in the header. Beneath it sits a block, labelled reference or read, that lists the prior instruments the document acts on — by number and by date.
And in the body, a substantial minority state plainly what they are doing to those earlier instruments: superseding them, cancelling them, amending them, issuing a correction, or modifying them in part.
That is a citation graph, annotated with declared intent, written by the issuing authority. It has no label noise, because it is not labelled — it is a primary source. It needs no training data because there is no model. It needs no inference because the text says what it says.
The task stops being "predict whether these conflict" and becomes "read what the government already recorded, and organise it." That is a parsing problem, and parsing problems are cheap.
The Corpus, and Three Things That Make It Awkward
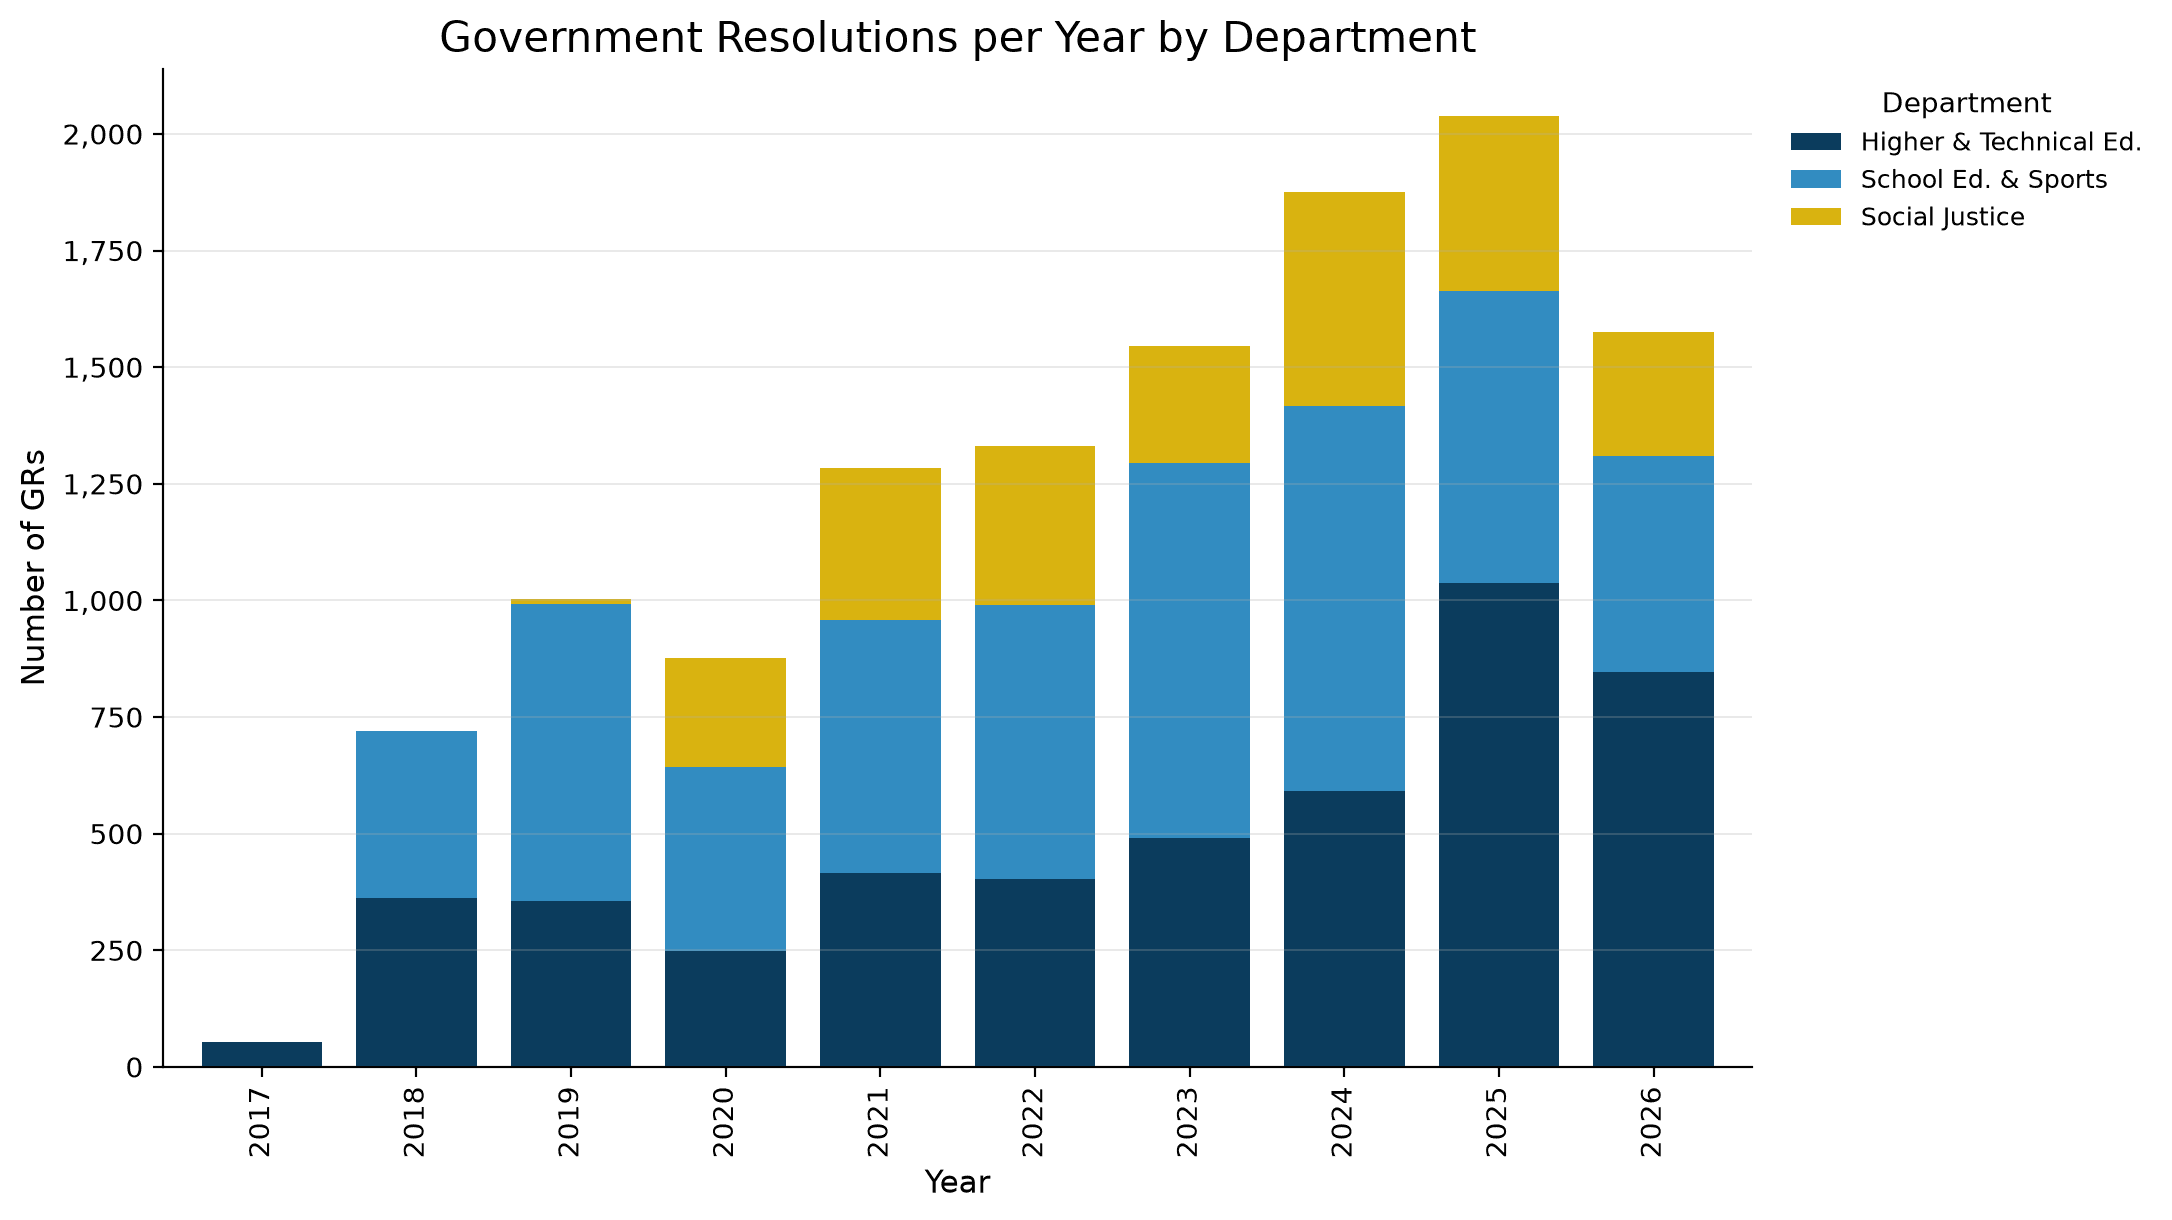
Roughly 12,300 resolutions from three departments of an Indian state government, spanning 2017 to 2026, held in a Postgres database.
Every document exists twice. The source text is Marathi, written in Devanagari script; an English machine translation sits alongside it. Counting rows rather than documents doubles every figure — a trap that anyone querying this table falls into once.
The English is a translation of an OCR pass, not a source. Errors compound across both steps. In one document the header field for date is rendered as "Date of Birth". In another, the opening line of an English translation describes a national cabinet committee that appears nowhere in the Marathi original. Anything turning on exact wording — amounts, deadlines, named authorities — has to be read in Marathi, with the English demoted to a reading aid.
There is no date column. The publication date is encoded in the first eight characters of the document's identifier. It records when the document reached the portal, which is typically a day or two after it was issued — a proxy, not the thing itself.
None of this is exotic. It is what public data usually looks like once you open it.
How the Work Was Actually Done
The entire analysis ran through an AI data assistant connected to the database — a tool that takes a question in English, writes SQL, executes it, and returns the result with the query it used.
The working method had three parts, and the first is the one that made the difference.
A written briefing, pasted before any question. Roughly a page: what the tables mean, that rows are not documents, where the date is hidden, why the English text cannot be trusted for numbers, and which columns are already computed and must not be recalculated. Without it, the assistant re-derives the shape of the data on every question and eventually tries to reprocess several hundred megabytes of text in a single query. With it, the questions become short.
A fixed sequence of questions, each building on the last: describe the structure, rank where risk concentrates, pull evidence for the top candidates, quantify what a quality filter would cost, then draw the charts.
An independent answer key. Before asking the assistant anything, the same extraction was run separately over the raw files, outside the database, producing a set of numbers to check every answer against. Nothing in this paper is reported on the assistant's word alone.
Finding One: The Reference Number Is Not an Identifier
The first result contradicted the assumption the analysis was built on.
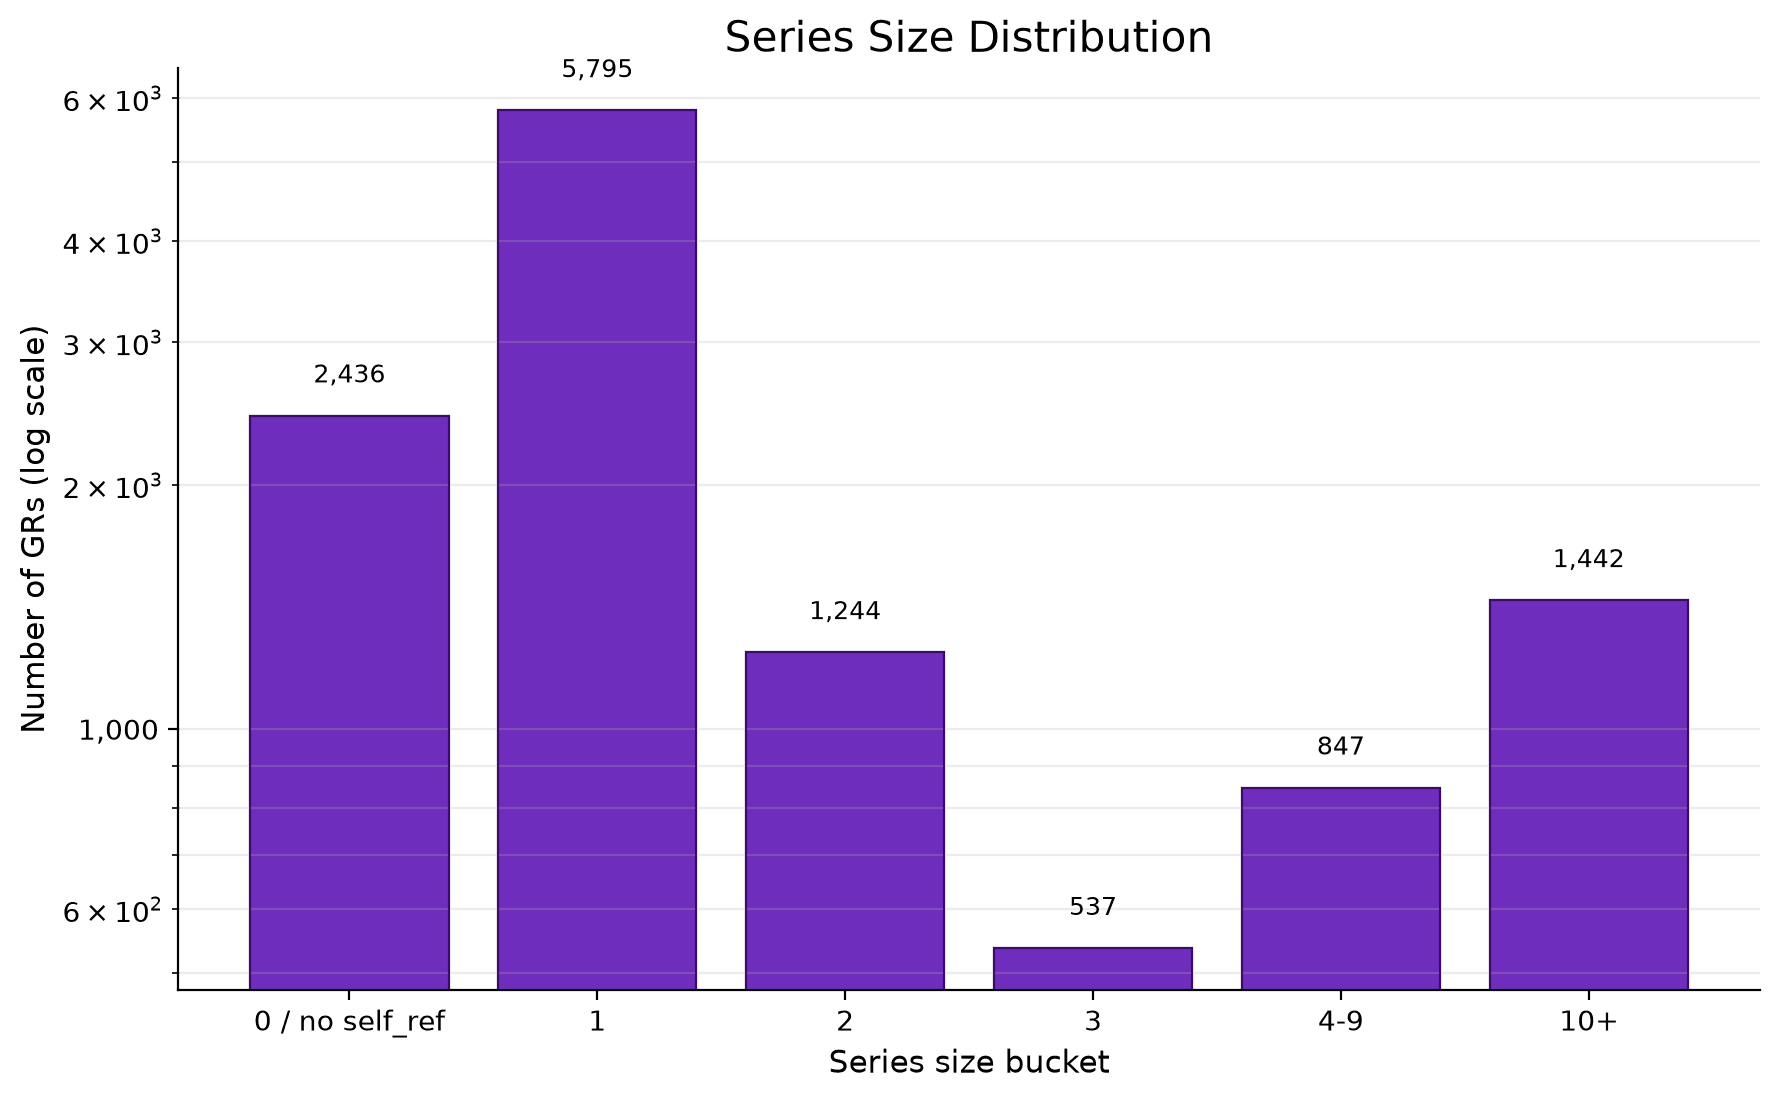
We had treated each document's reference number as a unique key — one number, one document. It is not. Around a thousand reference numbers are shared by more than one document, and together they cover roughly a third of the entire corpus.
A shared number is not a data-entry error. It means the same instrument was reissued repeatedly. The largest clusters run to ninety-odd documents under a single number.
So the reference number is a series label, not an identifier — closer to a case file than a document ID. That reframes the whole problem. The unit of analysis is not the document; it is the series.
The Check That Proved It Was Real
A pattern extracted by regular expression from OCR'd text in a script you cannot read deserves scepticism. The obvious worry is that the clusters are an artifact — the parser latching onto a common phrase and grouping unrelated documents.
The date ranges settle it.
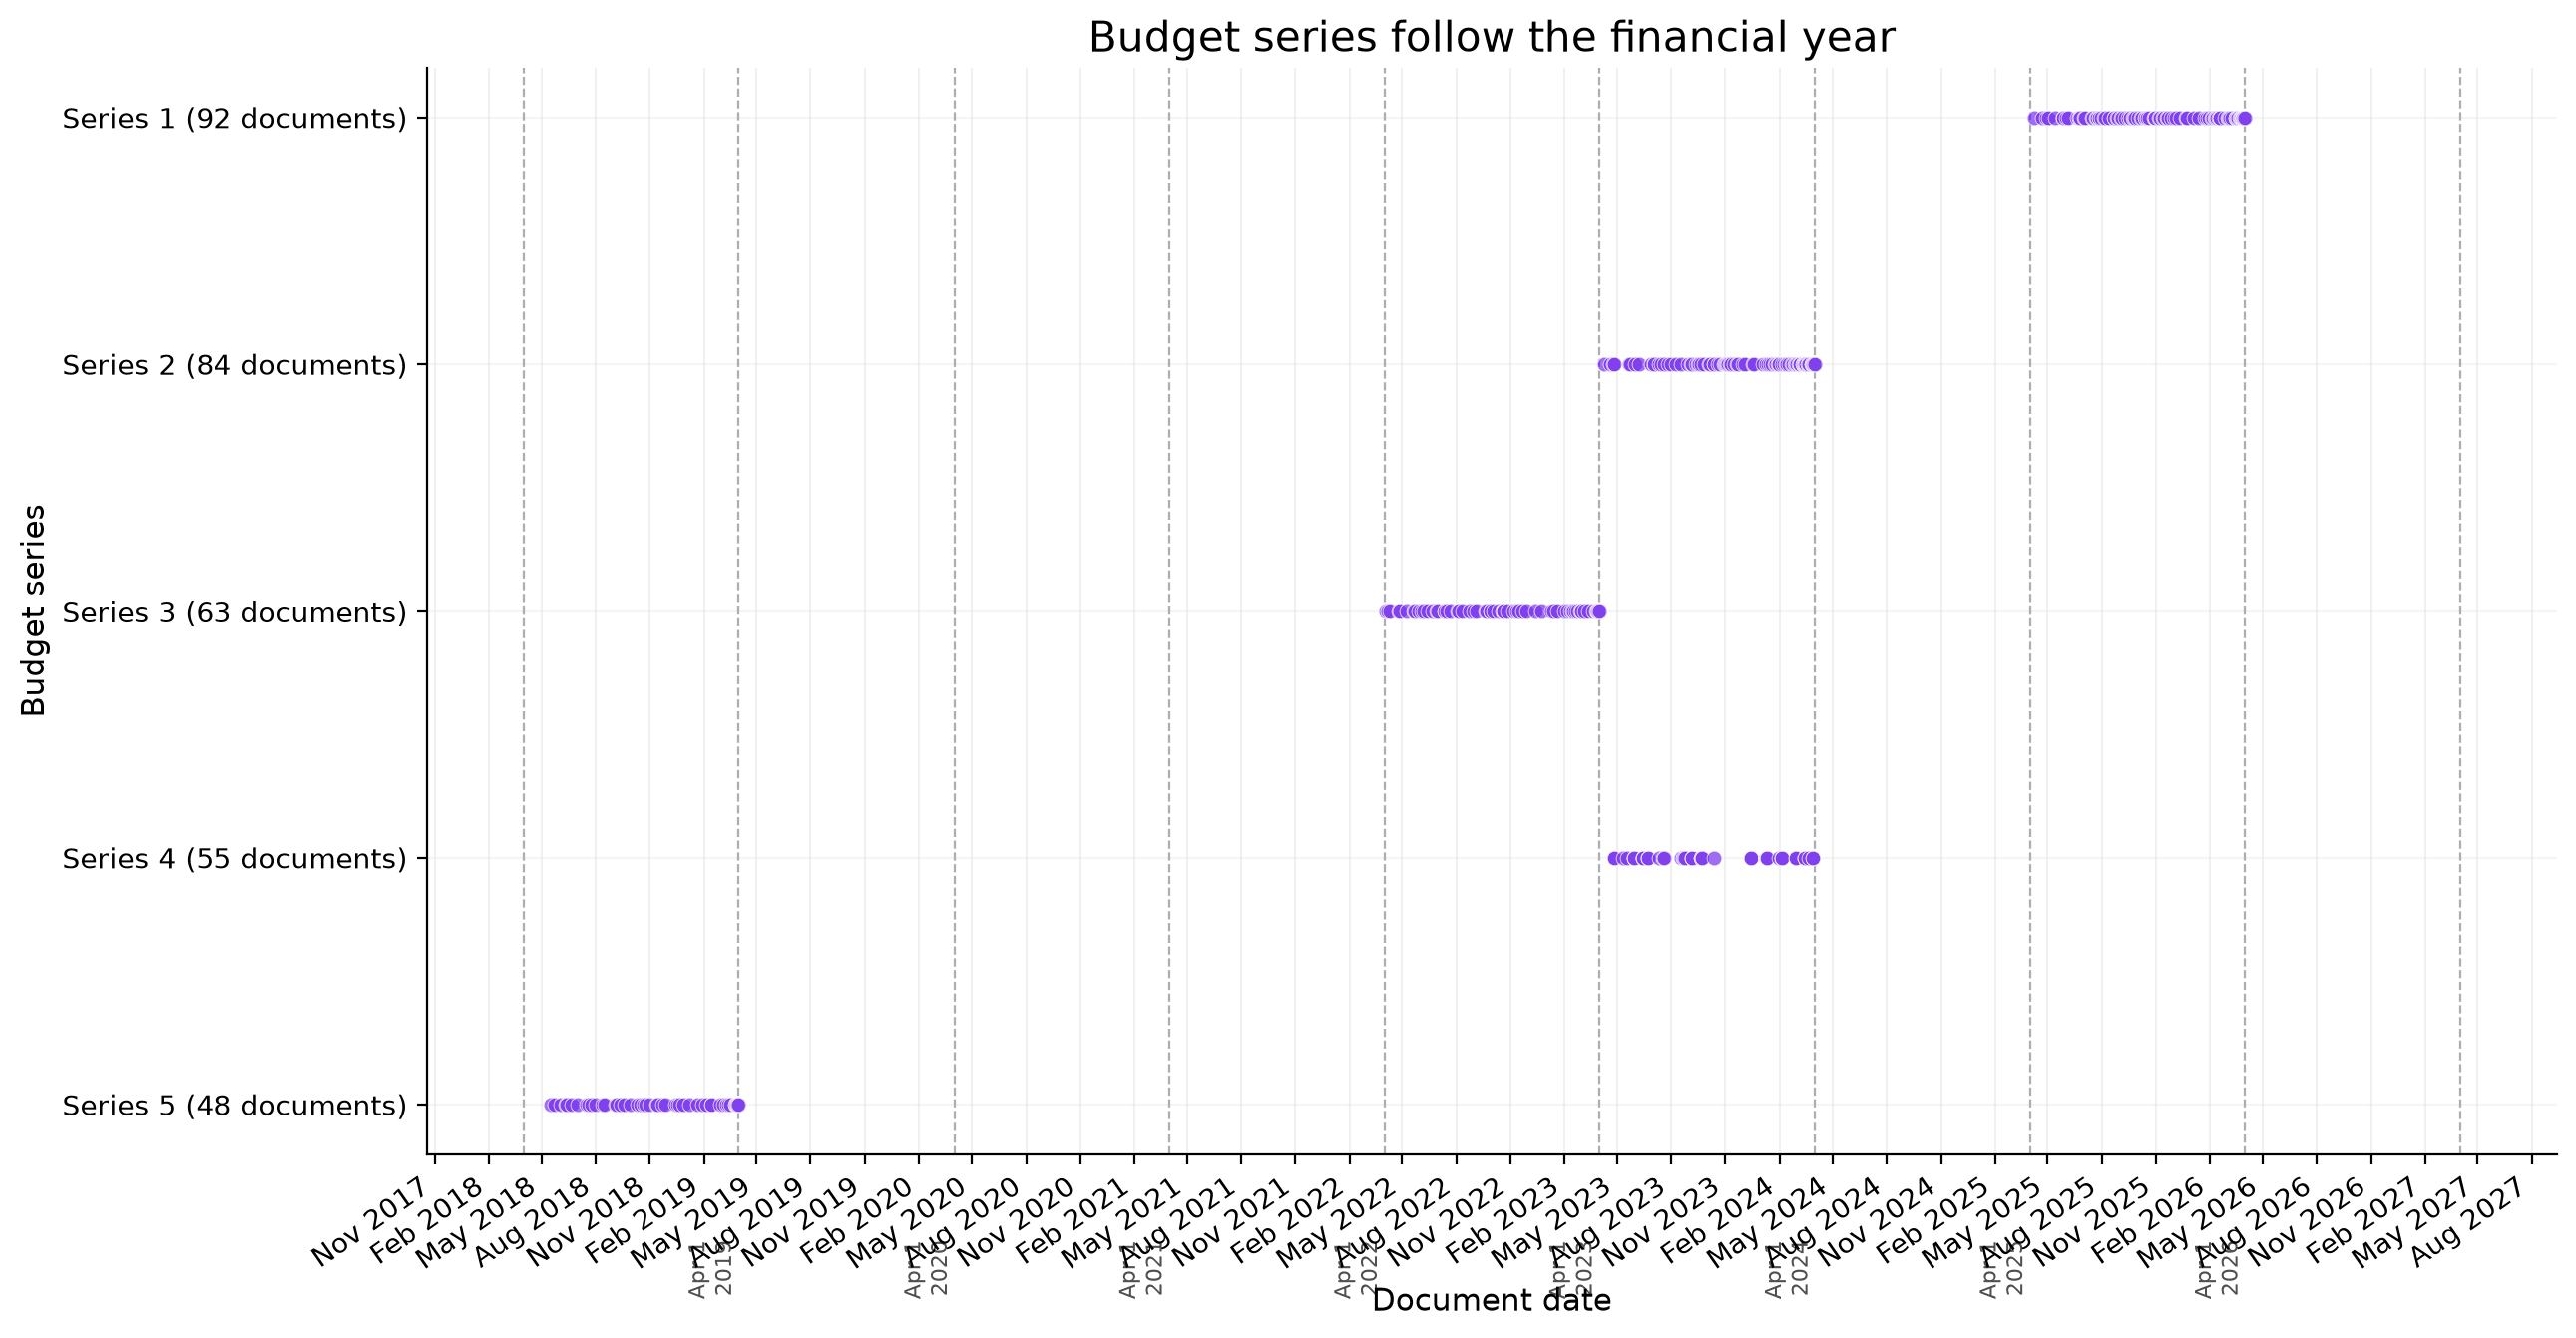
The largest clusters are budget-distribution series, and every one of them opens in the first week of April and closes in the last week of March. That is the Indian financial year, exactly. Plot them on a timeline and each series sits in its own clean twelve-month band, starting where the previous one ends.
The extraction was never told what a financial year is. It has no notion of April, no fiscal calendar, no domain knowledge of any kind — it matched a string in a document header. The clusters landing precisely on fiscal boundaries is the kind of confirmation you cannot manufacture by accident, and it converted the finding from plausible to solid in one query.
This is worth generalising: when you extract structure from messy text, look for an external regularity the extractor could not have known about. Internal consistency checks tell you your code is self-consistent. An unprompted alignment with the real world tells you the structure is real.
Finding Two: Nine in Ten Citations Point Somewhere You Cannot See
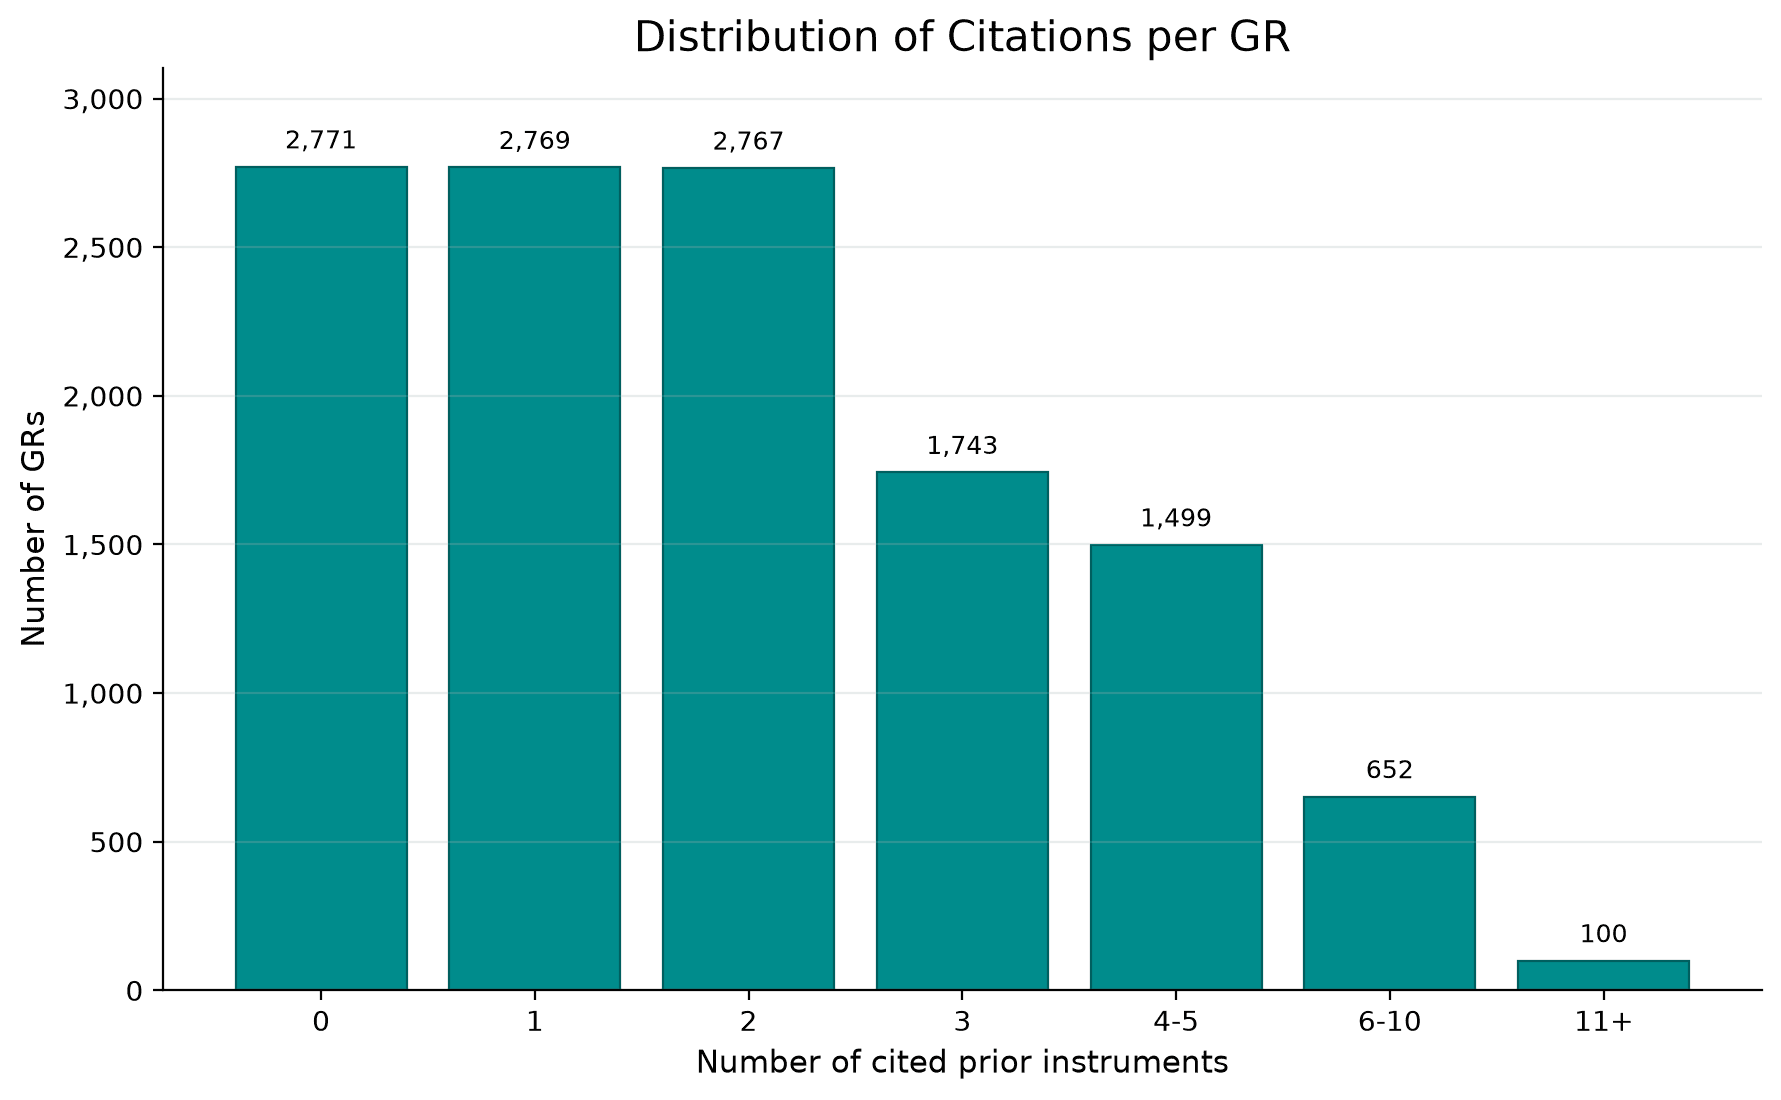
About three-quarters of the documents cite at least one earlier instrument. That sounds like a dense, well-connected graph.
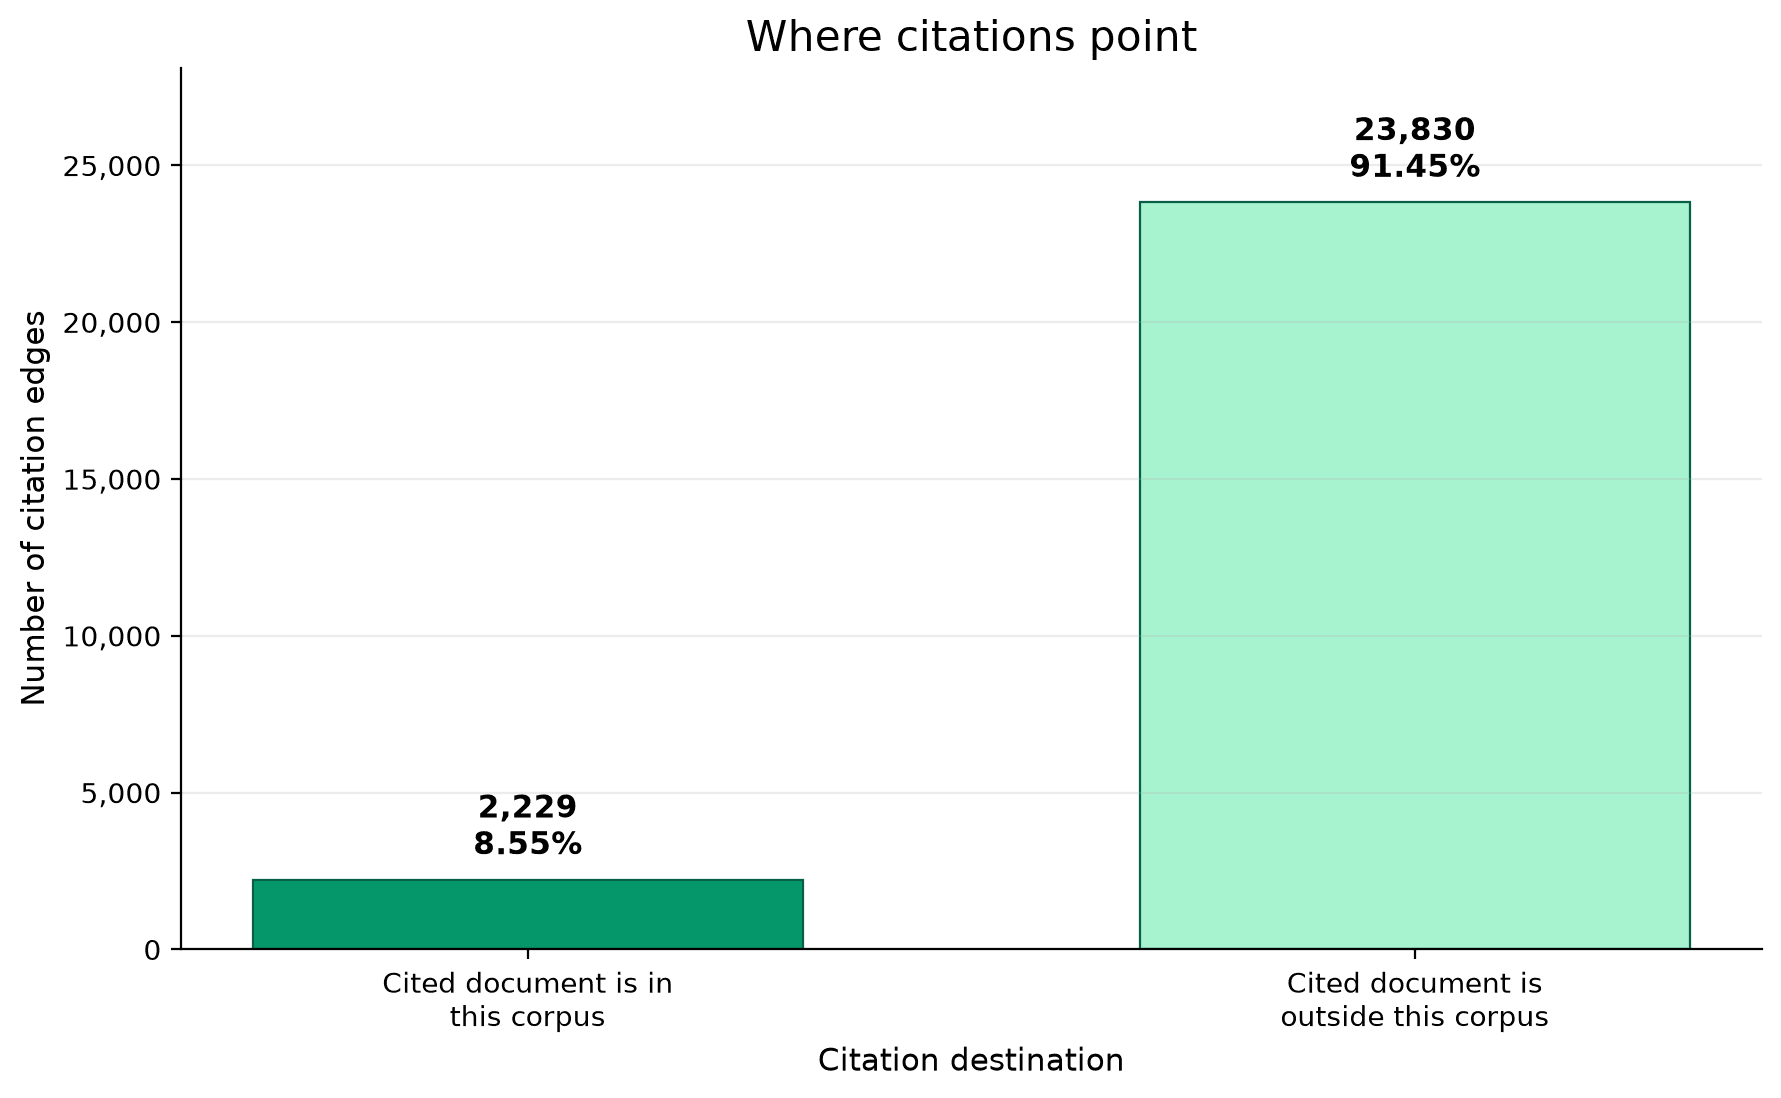
It is not. Roughly nine out of every ten citations point at something the corpus does not contain.
The reason is mundane and important. This dataset holds three departments out of the state's thirty-odd. A schools department resolution routinely cites a finance department circular, a national ministry order, or a decision from the 1990s that predates the digital archive entirely. All of those are outside the boundary.
The consequence is the single most important caveat in the paper, and it generalises well past this dataset. A conflict-detection system built on a departmental slice is reasoning about a fragment of the amendment web, and it cannot see the shape of what it is missing. It will report a document as unamended when the amendment exists in a department nobody loaded.
Any such system should state its coverage as prominently as its accuracy. A tool that says "no conflicts found" without saying "across three of thirty-five departments" is not being honest with its user.
Finding Three: Governments Cancel Far More Than They Supersede
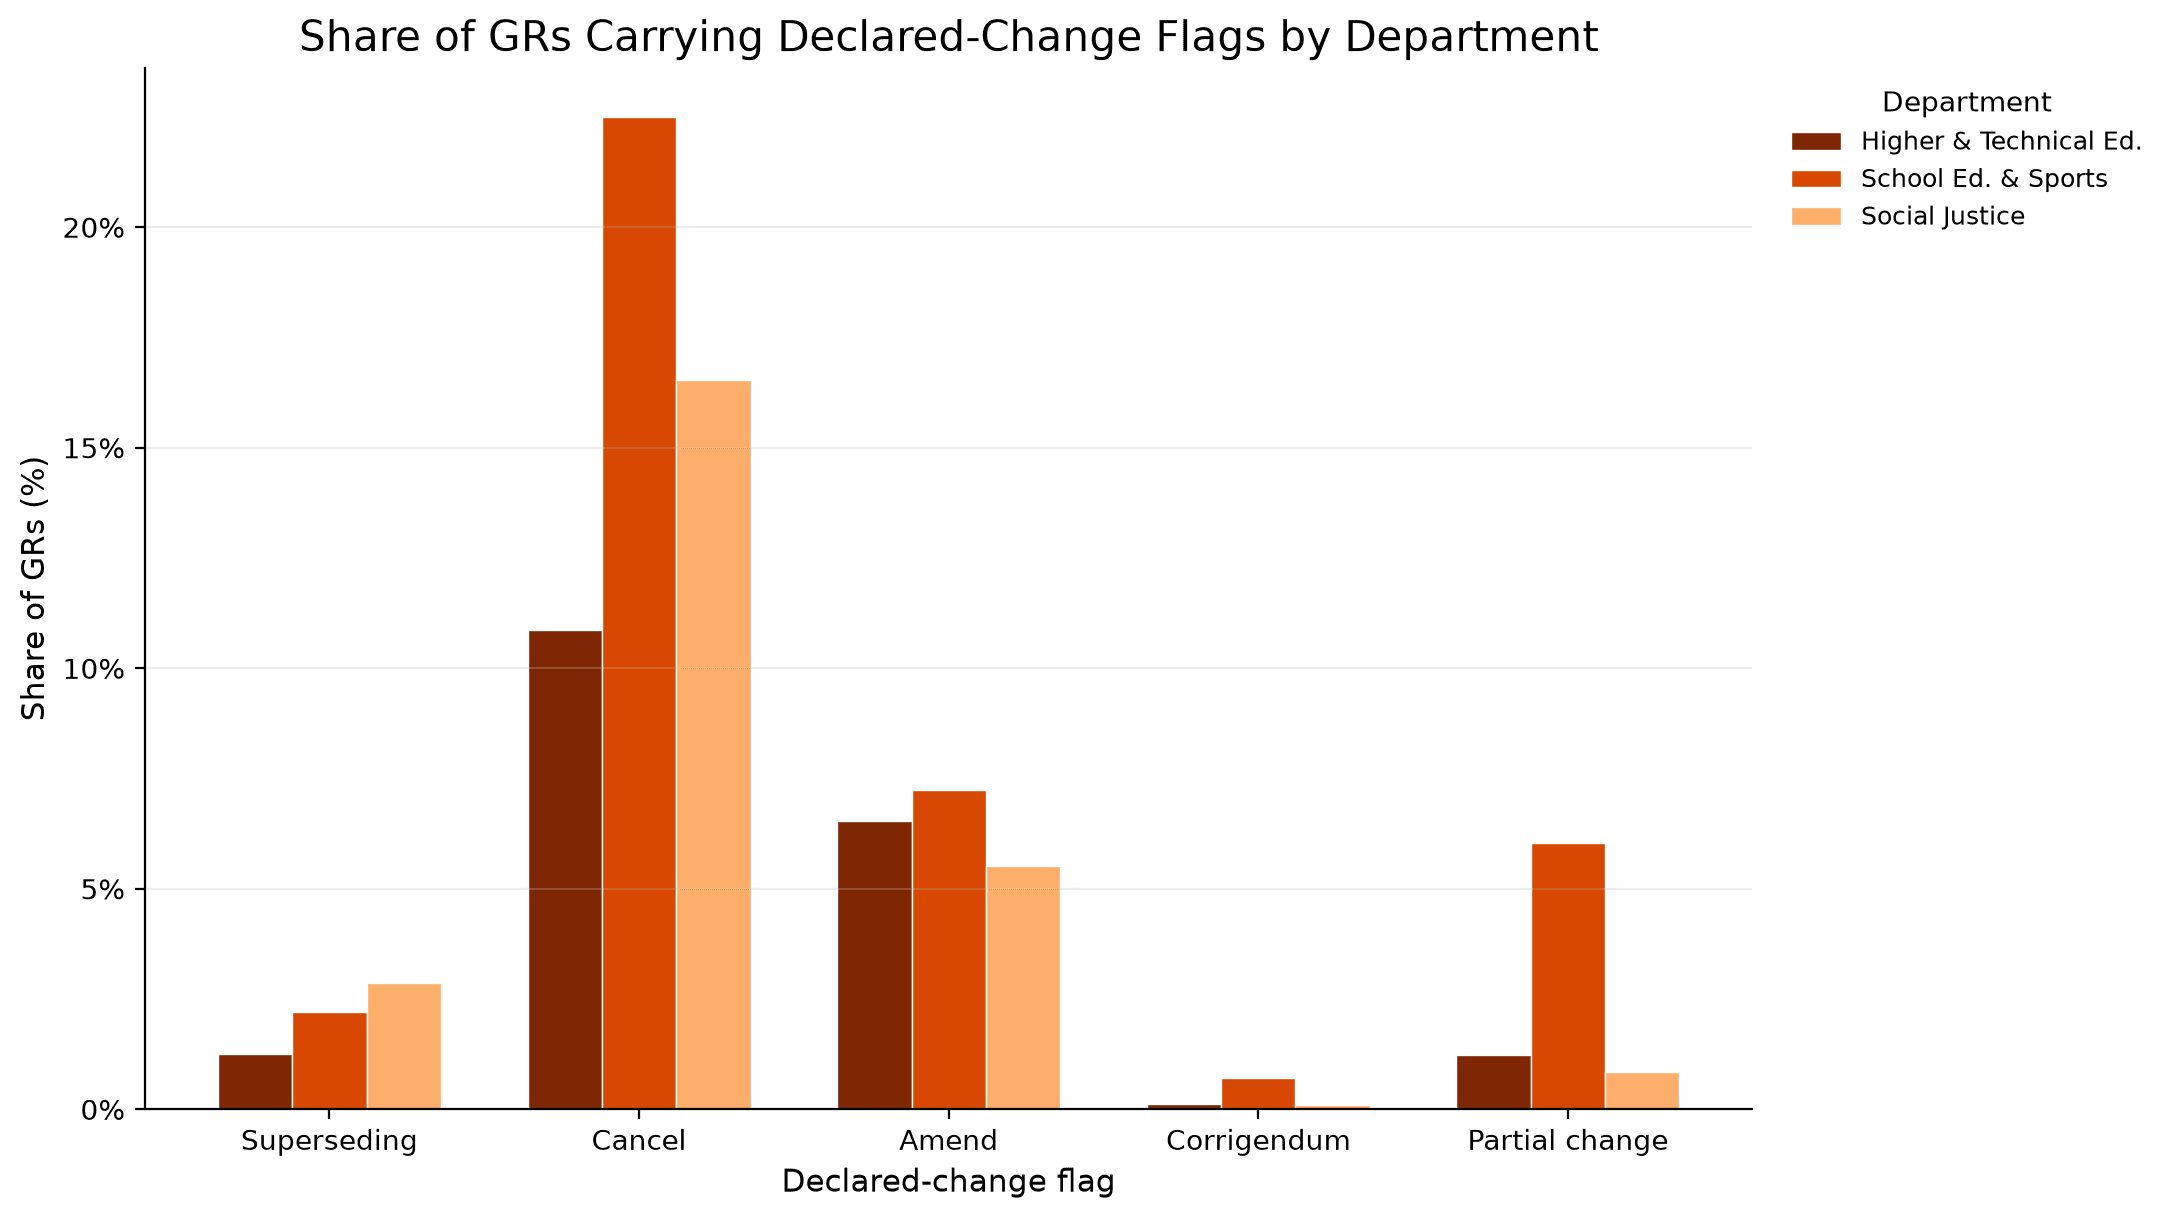
Around a quarter of the documents declare a change to something earlier. Reading the breakdown by type is more interesting than the total.
Cancellation is the dominant mode by a wide margin. Roughly one in five documents in the largest department uses the language of cancelling something. Formal supersession — the vocabulary you would expect from a legal system that tracks its own hierarchy — appears in under three percent. Corrigenda barely register at all.
There is a practical reading here for anyone building tooling on legislative or administrative text. If your detection logic keys on formal supersession language because that is what the drafting manual specifies, you will miss the overwhelming majority of real changes. The operative verb in practice is the informal one.
The departments also differ from one another in a way that matters. One cites prior instruments least often but has the highest share of documents inside a reissued series. Its instruments are repeated more and cross-referenced less — a different drafting culture, and a different detection problem. A single rule tuned on one department will underperform on the next.
Finding Four: A Shortlist Short Enough to Read
Three filters, applied in sequence, do the work.
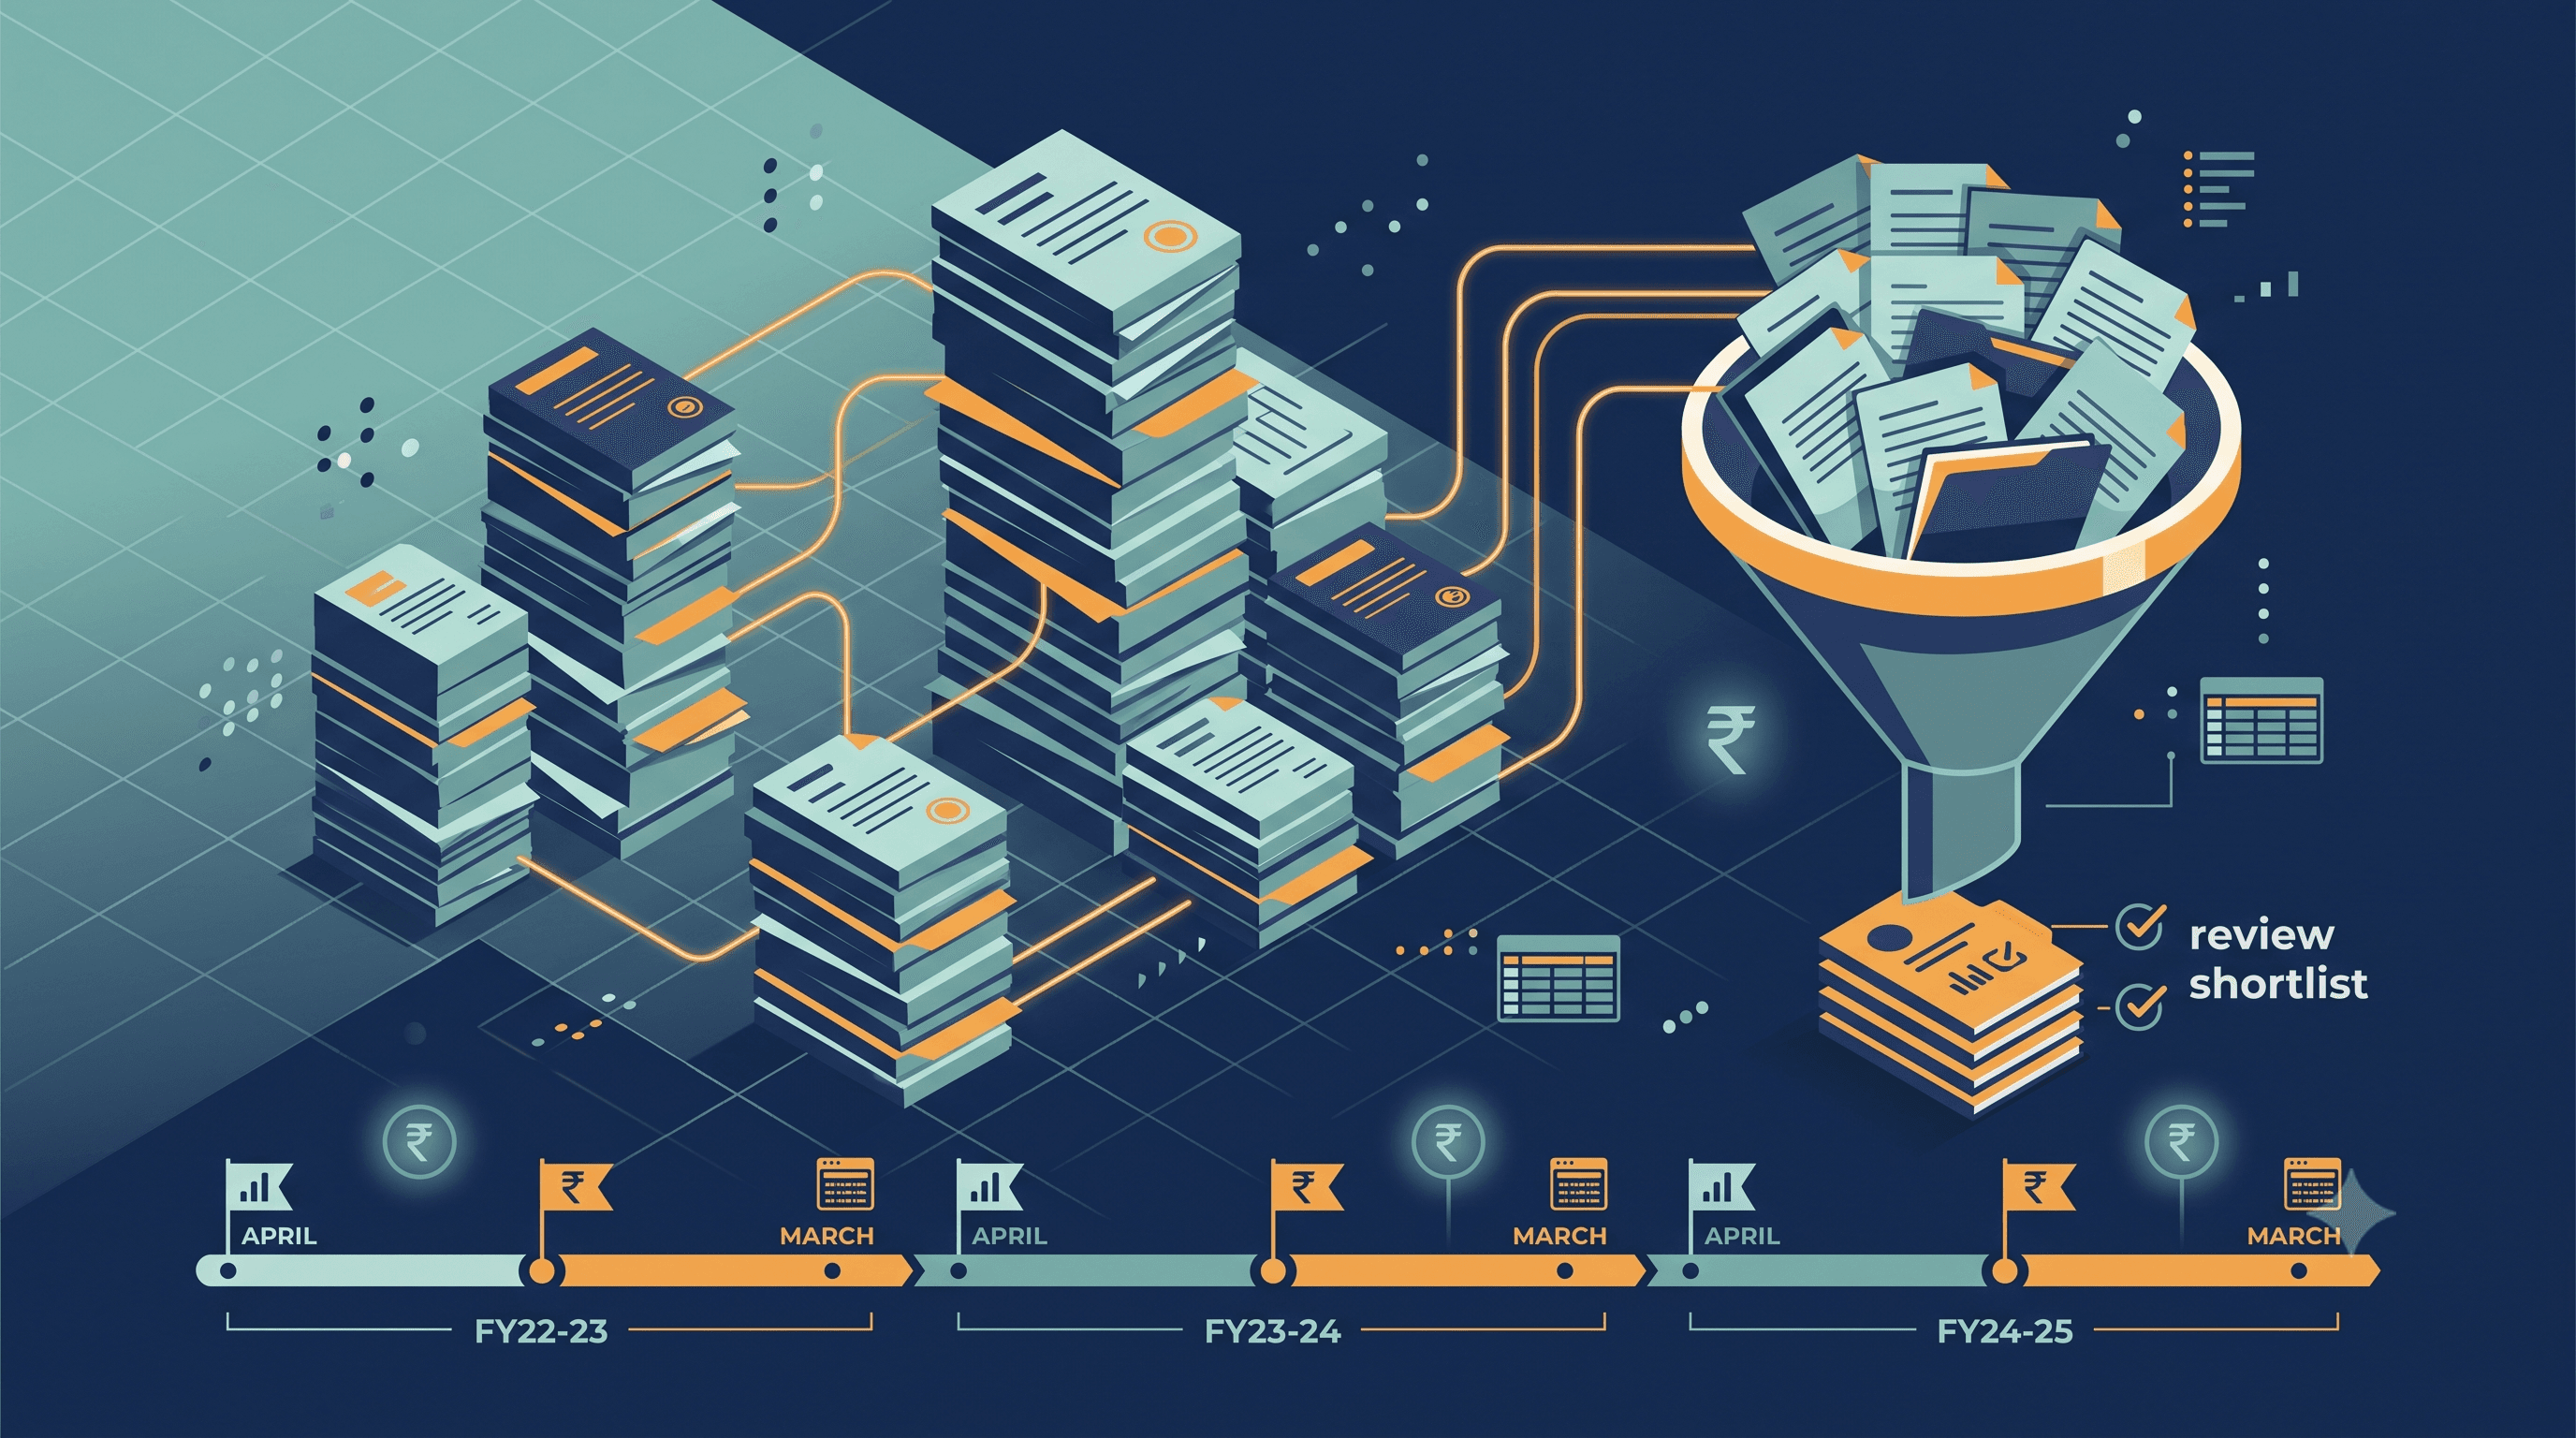
Start with every document. Keep only those inside a reissued series — a third of the corpus survives. Keep only those that also mention monetary amounts — about 1,700 remain. Keep only those that also declare a change to something earlier, and you are left with 209 documents.
That number is the deliverable. Twelve thousand documents is an archive; two hundred is an afternoon's work for one analyst. Narrowing the field by a factor of sixty, with the evidence attached to each candidate, is the difference between a finding and a report nobody acts on.
Within the budget series alone, ordering each series by date and pairing consecutive documents yields several hundred pairs for review — each one delivered with the Marathi text surrounding the first monetary figure on both sides, so a reader can see what changed without opening the source PDFs.
These are candidates for human review, not detected conflicts. That distinction was written into the request and repeated in the output, and it is not a formality. Nothing in this pipeline reads two clauses and judges them incompatible. It locates the pairs where a contradiction is most likely to be found and puts the evidence in front of a person. Presenting that as detection would be a claim the method cannot support.
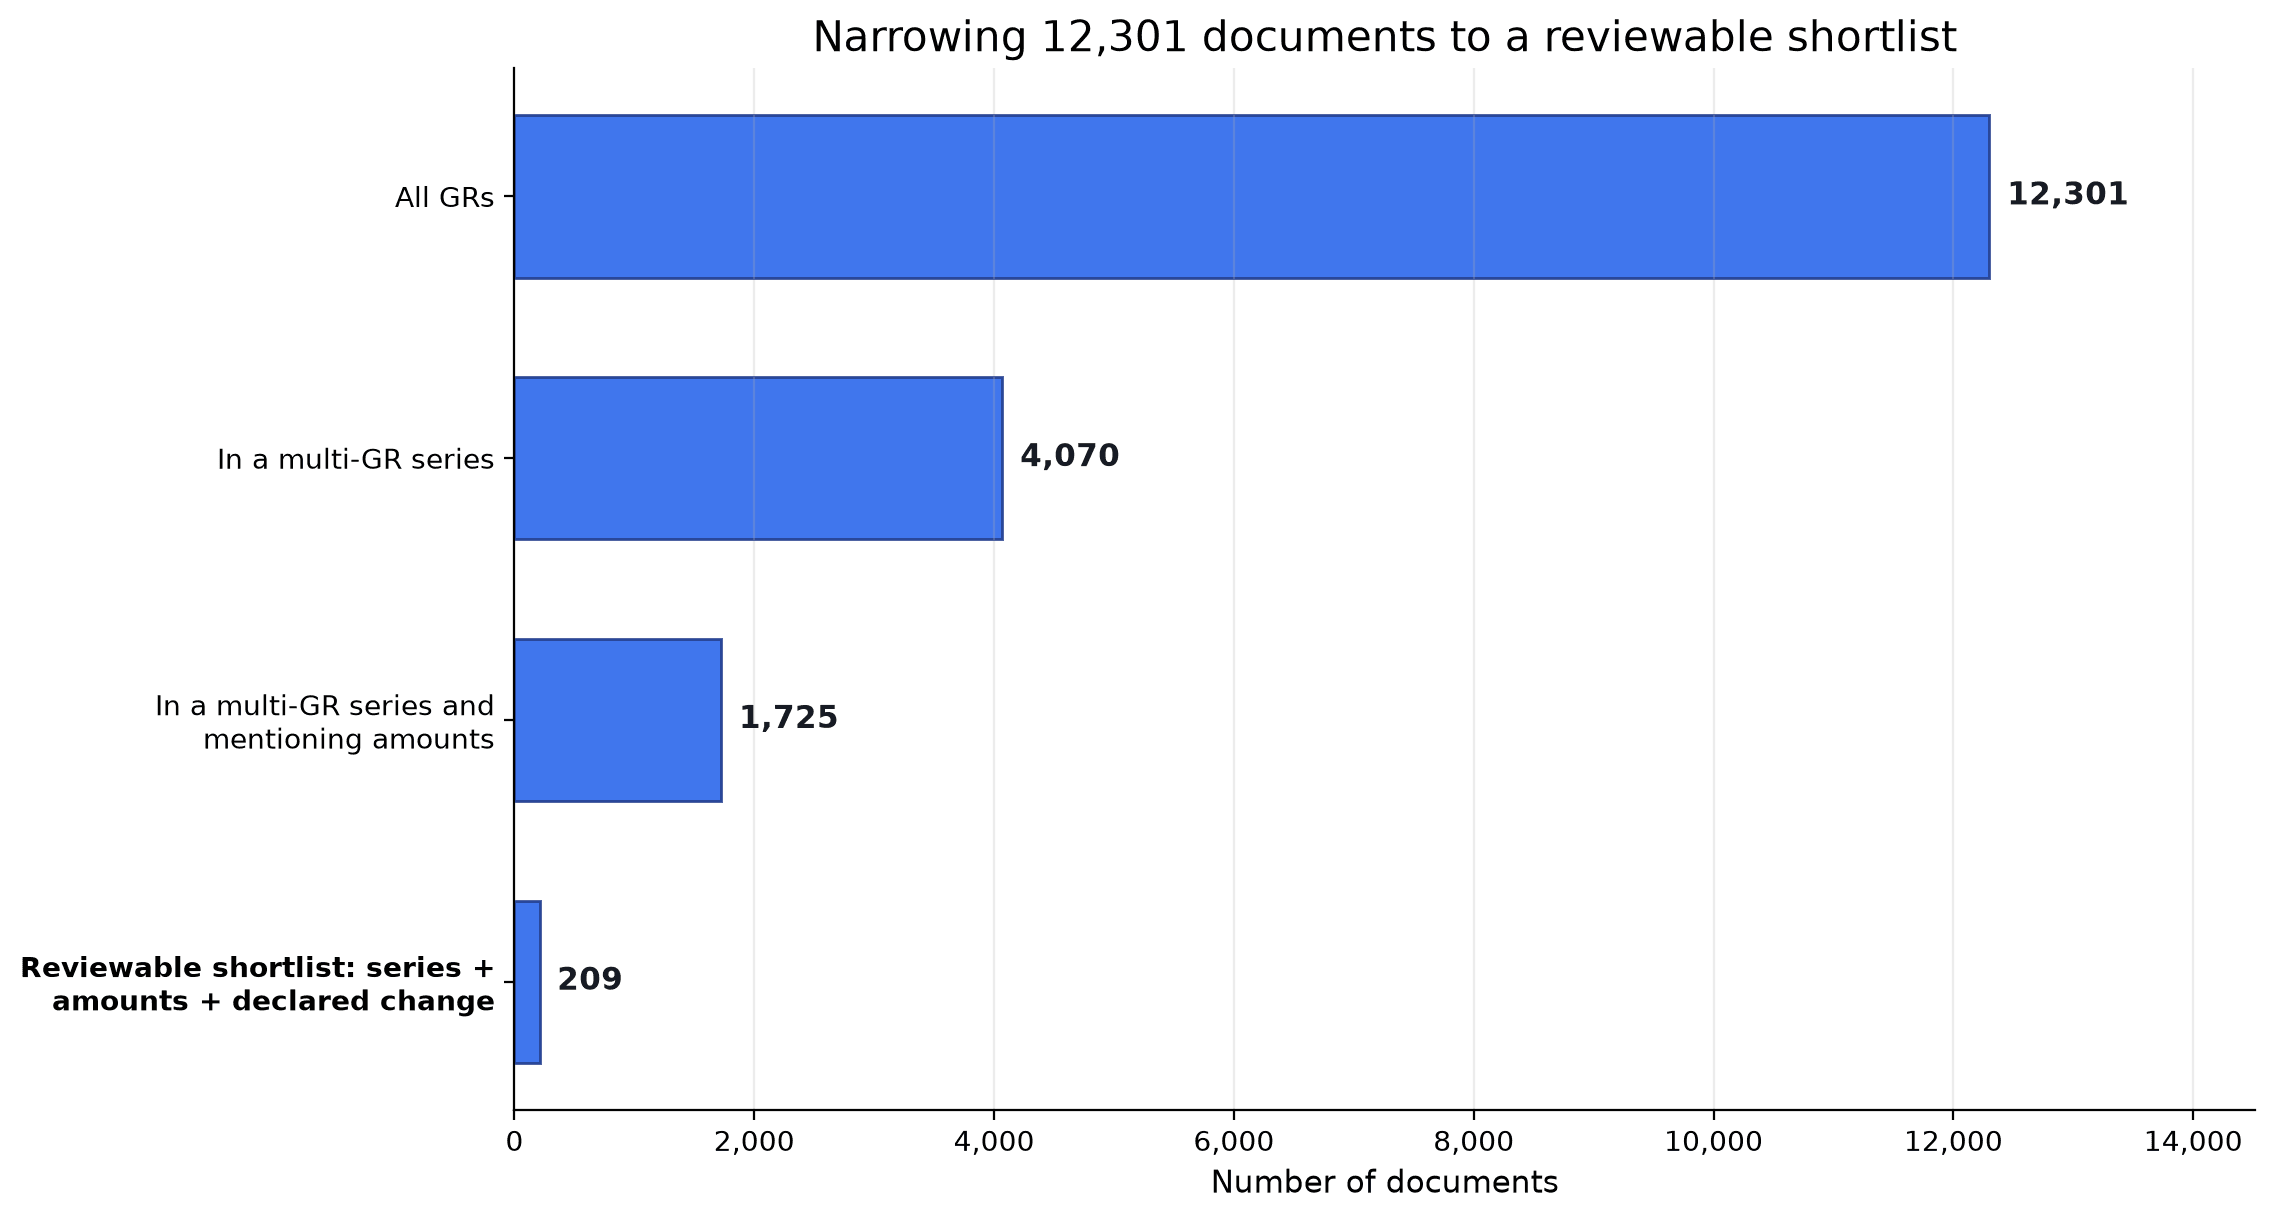
Twelve thousand documents is an archive. Two hundred is an afternoon's work. The value was never in the classifier — it was in narrowing the field to something a human can actually read.
A Prediction We Wrote Down, and the Data Corrected
Before any of this ran, one expectation was recorded in writing — because a prediction is only worth something if it is fixed before the result arrives.
The corpus carries a quality flag marking documents whose text extraction went badly. It fires overwhelmingly on long documents, and long documents in this archive are annexures: tables of rates, eligibility bands, district-wise allocations. Exactly where monetary detail lives.
The prediction was that filtering on that flag would silently discard the richest source of numeric conflicts — a trap that looks like good hygiene and quietly removes the evidence.
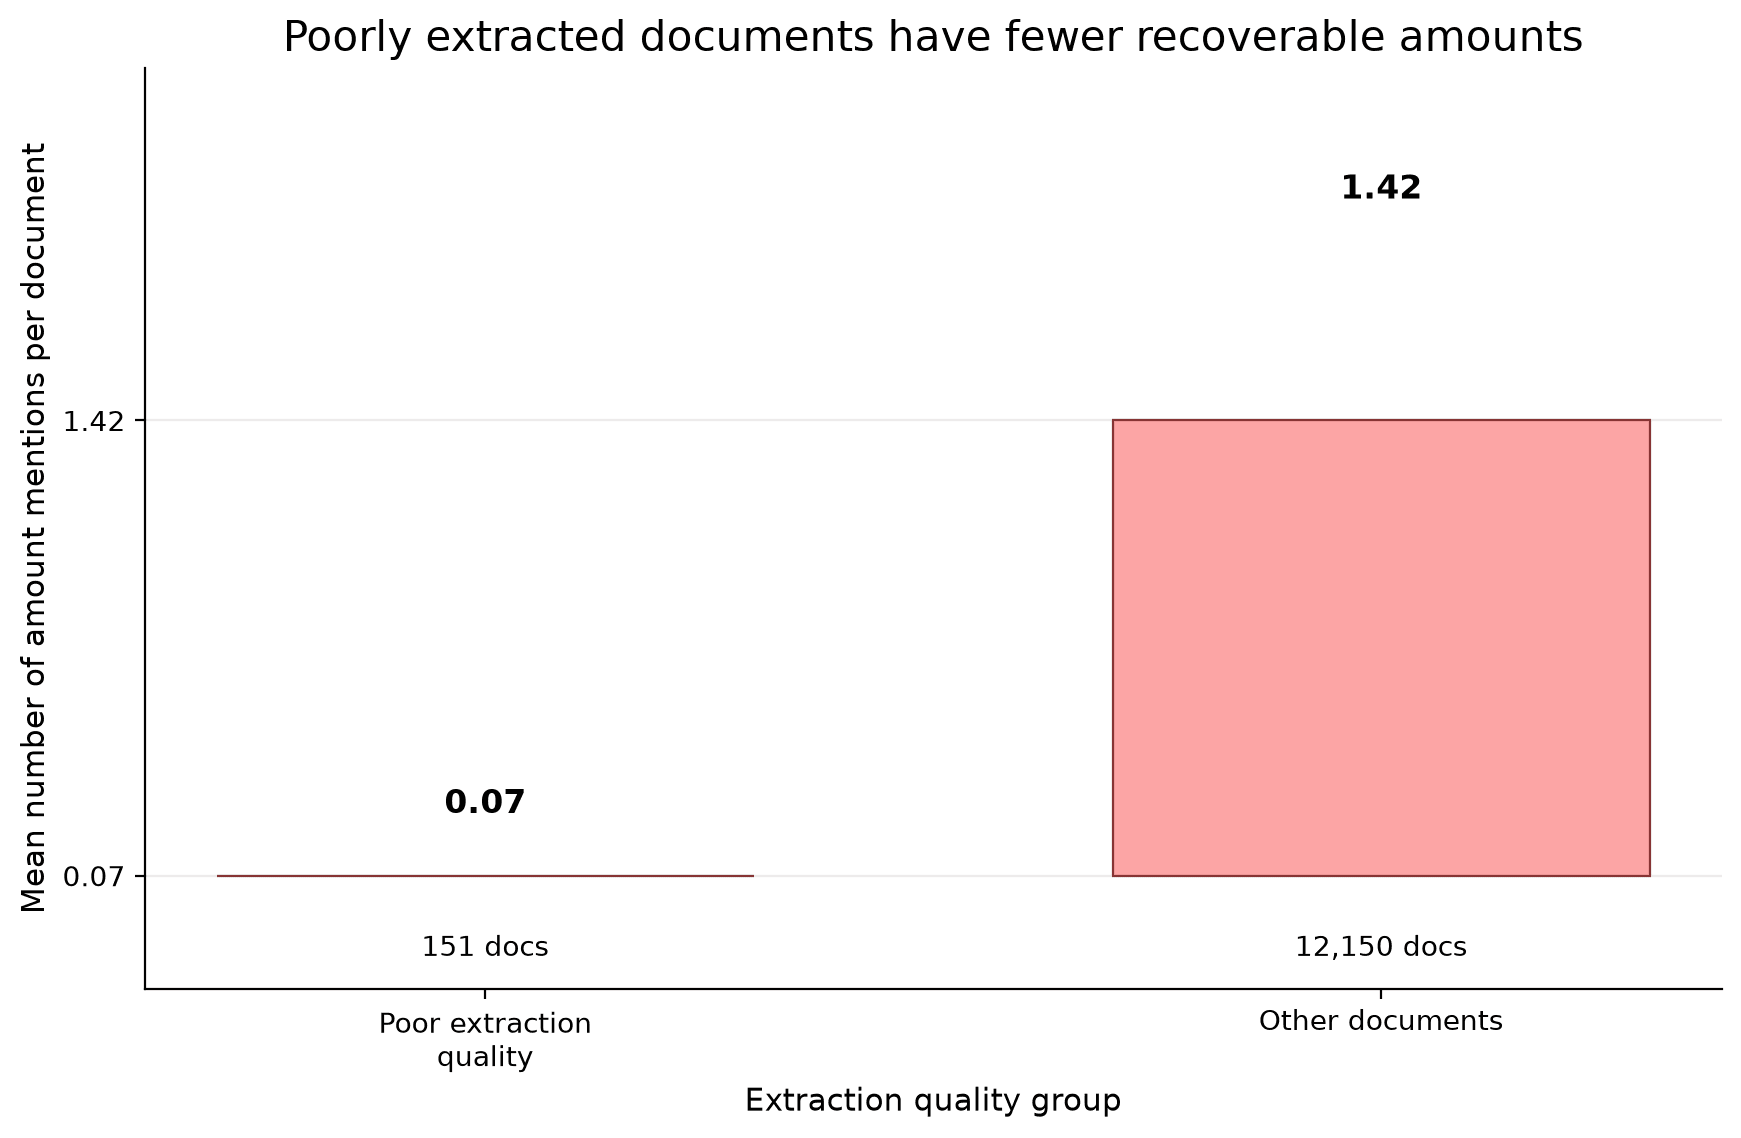
The structural half held, emphatically. Of documents longer than twenty pages, the large majority fail the quality check. The OCR pipeline barely read them.
The consequence did not hold. Applying the filter would have removed fewer than two percent of the change-declaring documents, and a negligible fraction of the monetary references.
Why the Prediction Was Wrong
The claim conflated two different things: documents that should contain amounts, and documents that do contain extractable ones.
Poorly-extracted documents average close to zero detected monetary references, against well over one for everything else. The OCR did not partially read those annexure tables and leave the figures in a degraded state. It failed almost completely — the numbers are not there to lose. They were never extracted in the first place, so a filter that removes those documents removes empty pages.
The warning survives in weaker form, and it is the form worth carrying forward. The quality flag is not neutral: it disproportionately removes long documents. Anyone whose review genuinely depends on schedules and annexures is still discarding exactly the material most likely to contain them — they just cannot recover it by keeping the rows, because the extraction already lost it. That is an upstream OCR problem wearing a filtering costume, and no amount of careful querying fixes it.
Notably, the assistant drew this distinction on its own. Asked to quantify the cost, it reported the small measured loss and then volunteered that the flag was structurally non-neutral and would matter for annexure-dependent work. That was the correct reading, and it was not requested.
What We Actually Produced
Four concrete outputs, all of which outlive the analysis:
A structured layer over the raw text. One row per document, carrying its reference number, how many prior instruments it cites, how many later documents act on it, how large its series is, how many monetary figures it contains, and which change-declaring language it uses. That layer is what turned a text-mining problem into ordinary SQL.
A ranked shortlist of 209 review candidates, each with the factors that put it there.
A pair file with evidence attached — consecutive documents within a series, with the surrounding Marathi text for each monetary figure, ready for a reviewer who reads the language.
Eight charts covering publication volume, series structure, the financial-year alignment, citation density and destination, declared-change behaviour by department, the shortlist funnel, and the extraction-quality comparison.
The first of those is the one worth stealing. Nothing downstream required text processing again — every subsequent question was a query against precomputed columns. Doing the expensive extraction once, into a table, is what kept the analysis fast enough to iterate on in a chat window.
The Assistant: What It Got Right
Every figure it produced was checked against the independent extraction. Five of the eight headline measures matched exactly. The remaining three sat within about two percent, and the cause was traced: our own script stopped reading a document's reference block one marker earlier than the database query did, so the database found slightly more citations. The assistant was not wrong; the two extractors drew a boundary in different places.
Four behaviours are worth naming.
It reported failure instead of inventing. Told to expect a specific number and finding the underlying table missing, it said the table was missing. Given how strongly the briefing signalled what the answer should be, a fabricated match would have been easy and nearly undetectable. This matches what earlier papers in this series recorded: it under-investigates, it does not invent.
It refused to guess when the question was ambiguous. On the evidence-pair request it asked a clarifying question, and when that went unanswered it proceeded with a documented assumption and stated exactly what it had assumed — rather than silently picking one.
It volunteered the right caveat, on the quality filter, unprompted.
It recovered from its own SQL errors without being told how. Two of the chart queries failed on database restrictions — a window function nested inside another window's ordering, and a sort referring to a column alias the query wrapper had already quoted away. It read the errors, rewrote both queries preserving the original definitions, and reported what it had changed and why.
The Assistant: What It Got Wrong
One failure, and it is the same one this series has now recorded four times in four unrelated domains.
Asked for the twenty most-cited instruments, it returned twenty rows. Those twenty rows contained two distinct instruments.
The reason is mechanical. The citation count is attached to the reference number, and — per the paper's own central finding — many documents share one. So ranking documents by that count returns whole clusters: the same instrument repeated, over and over, in what looks like a leaderboard.
The output was literally correct. Every row was accurate. It was also analytically useless, and it passed without comment.
This is the pattern worth carrying to your own work. The failure mode is not inaccuracy — the numbers are right. It is a lack of curiosity about the shape of its own output. A human analyst who wrote that query would glance at the result, notice the same name repeating eleven times, and immediately understand what it meant. The assistant produced it, formatted it, summarised it, and moved on.
The practical defence is cheap: ask for distinct counts alongside every ranking. "Top twenty, and how many unique entities does that represent" would have caught this instantly, and costs nothing.
A smaller instance of the same thing appeared in the charts. Asked for plain-English labels, it rendered a timeline whose row labels were Marathi reference numbers — in a font with no Devanagari glyphs, so they came out as empty boxes. It noticed on review and regenerated. Worth flagging because the first version looked fine at a glance, and a chart full of blank rectangles is exactly the kind of thing that reaches a slide deck.
Three Platform Walls, None of Them the Model's Fault
Most of the session was spent not on analysis but on the tool's plumbing. These are worth documenting because they are invisible until you hit them, and they are not model behaviour.
The query interface is read-only. It executes queries and refuses anything that changes structure. All schema work has to happen in the database directly. Reasonable as a safety design — but it means "ask the assistant to build you a table" is not a workflow, and no phrasing gets around it.
The query wrapper rejects a trailing semicolon. Queries are wrapped in an outer statement before execution, and a semicolon breaks the wrapping with a parser error that points at the wrong thing entirely. Trivial once known, genuinely confusing before.
It reads a data source's schema once, when the connection is created, and never again. This one cost the most time. Newly created tables and newly added columns are invisible to the assistant permanently, regardless of re-syncing. The query layer validates against its stored copy of the schema and rejects unknown names before the database is ever contacted — so the error says the table does not exist while the table sits there, populated, one layer down.
The Workaround, and What Gave It Away
The fix for the frozen schema turned out to be sitting in the tool's own history.
Two connections to the same database had been created weeks apart. The older one could see only the tables that existed on the day it was made. The newer one could see those plus a table created in between — and neither could see anything added afterwards.
That is the signature of a schema snapshot taken at connection time. So the solution is not to refresh a connection but to create a new one pointing at the same database, which imports the current schema on creation.
It worked immediately. The cost was a session spent debugging what looked like a permissions problem and was actually a caching one.
The generalisable lesson for anyone evaluating this class of tool: find out when it reads your schema, and what — if anything — makes it read again. That single question determines whether the tool fits an evolving analysis or only a finished one. It is rarely in the documentation, and it does not surface until you are already committed.
An Honest Note on the Briefing
The one-page briefing pasted before every session is doing real work, and it deserves scrutiny rather than celebration.
It contains verified facts about the data. It also contains expected answers — the totals the assistant should arrive at, stated as ground truth. That was deliberate: it lets a wrong query announce itself immediately, and it caught at least one issue early.
It is also, unavoidably, a way of telling the model what you want to hear. The safeguard is that every number was independently reproduced outside the tool, so a fabricated match would have been caught. Without that safeguard, priming a model with the expected answer and then reporting that it agreed would be close to worthless as evidence.
Worth stating plainly, because the technique is genuinely useful and genuinely double-edged: a briefing that contains expected values is only sound if you can verify the answers elsewhere. If you cannot, leave the numbers out and let the tool tell you what it finds.
Limitations
Coverage is the dominant limitation. Three departments of roughly thirty-five. Nine in ten citations leave the corpus. Everything here describes a fragment, and the missing part is not randomly distributed — it is whole departments.
Around one document in five carries no extractable reference number and is invisible to the entire series analysis. Header layouts vary, OCR fails, some documents simply do not follow the template.
Dates are portal upload timestamps, not issue dates. Ordering within a series is reliable at the scale of weeks and should not be trusted to the day.
Detecting monetary figures is not the same as comparing them. The pipeline counts and locates amounts; it does not parse them into comparable values or match them to what they fund. Two figures moving between documents is a reason to look, not evidence of a contradiction.
Nothing here was validated by a domain expert. The 209 candidates have not been reviewed by anyone who administers these schemes. The precision of the shortlist is unmeasured — this paper reports how the shortlist was built, not how good it is.
What Would Actually Improve This
Parse the monetary figures into comparable values and track them across each series — the current pipeline finds where amounts exist, and the obvious next step is flagging where they move without a declared change to explain it. Load more departments, because coverage is the binding constraint and no amount of method fixes it. Put the 209 candidates in front of someone who administers these schemes and measure how many are real, which is the only way to turn a shortlist into a validated one. Improve the extraction upstream rather than filtering downstream, since the annexure tables that matter most were lost at OCR and cannot be recovered by better querying. And match cited references by date as well as by number, which would rescue a meaningful share of the citations that currently dangle.
Conclusion
The method here has no model in it. No training run, no labels, no held-out set, no accuracy figure — because there is nothing to be accurate about. It reads what the documents say about each other and organises it.
That is a smaller claim than "we built a contradiction detector", and it is a more useful result. Twelve thousand documents became a two-hundred-item shortlist with evidence attached, in an afternoon, using questions typed into a chat window against a database.
Two things to take away.
On the method: before building a model to infer structure, check whether the documents already state it. Institutional text is written to a template by people following a manual, and templates are parseable. The clause-pair classifier we abandoned would have needed thousands of noisy synthetic labels to approximate something the source documents record explicitly, in their own words, for free. Look for the declaration before you build the inference.
On the tooling: the assistant's arithmetic was, as far as we could verify, flawless — and it still handed us a leaderboard containing two distinct entries without noticing. The risk with this class of tool is not that it computes the wrong number. It is that it computes the right number to a question that has stopped being meaningful, and has no instinct that anything is off. Verification catches bad arithmetic. Only curiosity catches a well-formed answer to the wrong question, and that is still the part you have to bring yourself.
Notes on Sources and Method
The corpus is drawn from a public archive of Maharashtra state government resolutions, covering the Higher and Technical Education, School Education and Sports, and Social Justice and Special Assistance departments. Source documents are Marathi PDFs; the text used here is an OCR extraction with a machine-translated English parallel version.
All figures were produced twice — once by the AI data assistant against the database, and once by an independent script running directly over the source files with no database involved. Where the two disagreed, both numbers are reported along with the reason.
Every chart in this paper was generated by the assistant itself, from SQL it wrote, at the resolution requested.
The AI analysis tool is referred to anonymously throughout, matching the convention used in the earlier papers in this series.
Explore the Full Conversation
Read the complete conversations behind this analysis:

10 September 2026
Designing CertusAI: A Compliance-First Enterprise LLM Platform for Regulated Industries
As enterprise adoption pivots from raw model parameter scale to verifiable trust, CertusAI introduces a compliance-first LLM architecture engineered specifically for highly regulated industries. By integrating real-time PII redaction, deterministic policy enforcement, and cryptographically signed audit chains directly into the inference pipeline, CertusAI unlocks agentic AI productivity while ensuring total data sovereignty and statutory compliance.

10 September 2026
E-Commerce Return Intelligence: Analyzing Return Drivers and Predicting Purchase-Time Return
Addressing reverse-logistics friction and return-rate costs in fashion e-commerce, this study leverages the 1.37M-record ASOS GraphReturns dataset to evaluate product, pricing, and country-level return drivers. Using Terno AI for structured analysis alongside a deployed Logistic Regression baseline, the platform provides purchase-time risk scoring to power relative risk ranking, operational prioritization, and non-punitive intervention pilots.

10 September 2026
Global Food Loss Intelligence: Strategic Screening & Decision Framework
An executive decision-support whitepaper translating the official FAO Food Loss Index (SDG Indicator 12.3.1a) into actionable intelligence for 2021–2023. This study establishes a data-driven monitoring baseline across major commodity groups, identifying Fruits & Vegetables (3-year mean index of 109.65) as the primary priority for diagnostic follow-up while offering structured strategies for public policy, industry benchmarking, and evidence-based resource allocation.