
1. Executive Summary & Problem Overview
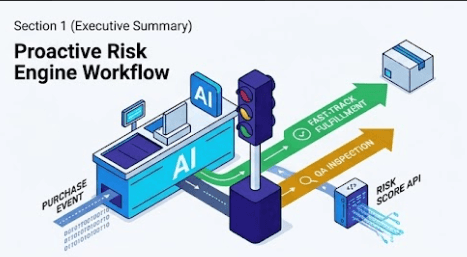
Fashion e-commerce operates under an inherent structural challenge: consumers make purchasing decisions without the ability to physically inspect, feel, or try on garments. Consequently, product returns create massive operational inefficiencies, elevated reverse-logistics costs, inventory depreciation, and customer-experience friction. Moving from reactive, historical return dashboards to a proactive return-intelligence capability requires estimating return risk at the exact point of purchase.
This study investigates the ASOS GraphReturns dataset to identify key purchase-time drivers associated with returns and evaluate whether statistical and machine learning models can accurately score return risk. The analytical dataset was created by merging three training-side source files (event_table_training.p, product_nodes_training.p, and customer_nodes_training.p) into a master analytical dataset containing 1,369,133 purchase records. A balanced 100,000-row sample was leveraged for structured Terno AI exploratory analysis, while the full master dataset was reserved for deployment modeling.
Rather than jumping directly to complex black-box algorithms, an evidence-first analytical workflow was employed. Logistic Regression was selected as a transparent, deployable baseline model. Evaluated on a held-out test set of 273,827 records, the model achieved an ROC-AUC of 0.6431, PR-AUC of 0.6793, Recall of 0.7355, and an F1 score of 0.6731. The resulting pipeline is deployed via a browser-based Flask application that converts transaction attributes into real-time return probability scores and qualitative monitoring interpretations.
| Decision Area | Operational Recommendation | Technical Rationale |
|---|---|---|
| Model Architecture | Retain Logistic Regression as the baseline. | Offers direct linear coefficient interpretability, low latency, and straightforward deployment. |
| Primary Business Use | Relative risk ranking and segment prioritization. | Supports prioritization of QA, sizing reviews, and logistics planning rather than causal claims. |
| Decision Thresholding | Avoid fixed 0.50 classification thresholding. | Operational threshold must be calibrated against explicit financial costs of false positives vs. false negatives. |
| Deployment Strategy | Implement controlled pilots and risk monitoring. | Serves as a decision-support tool; prohibits automated, punitive customer actions. |
2. Business Problem & Strategic Objectives
Traditional e-commerce analytics rely heavily on historical reporting, providing aggregate metrics on return rates after products have already been shipped, processed, and restocked. While informative, historical reports do not provide actionable intelligence for individual active purchases. The Return Intelligence layer addresses this operational gap by generating a risk probability score before the return event takes place.
| Approach | Step 1 | Step 2 | Step 3 | Step 4 |
|---|---|---|---|---|
| Traditional | Purchase | Logistics | Return Event | Post-Hoc KPI |
| Proactive | Purchase | Risk Score API | Targeted QA / Prioritization | — |
Core Strategic Objectives:
Product-Page & Sizing QA: Identify product categories and brands displaying disproportionately high return rates to target sizing guides, fit notes, and high-resolution imagery reviews.
Cross-Border Operational Insights: Detect shipping destination anomalies to isolate geographical delivery delays, local policy issues, or reverse-logistics friction.
Inventory & Reverse Logistics: Inform warehouse operations and reverse-logistics capacity planning using aggregated risk-score distributions.
Controlled Experimentation: Establish baseline risk segments to test non-punitive interventions, such as proactive sizing prompts or pre-shipment customer support.
3. Dataset Architecture & Data Quality Profile
The study utilizes the published ASOS GraphReturns dataset. The dataset integrates product-level attributes, customer demographic profiles, and purchase event records. Three primary source files were merged to create the training master dataset:
event_table_training.p: Core transaction logs detailing purchase outcomes.product_nodes_training.p: Granular product metadata including category classifications, brands, and pricing.customer_nodes_training.p: Demographic indicators and loyalty status records.
| Column Name | Data Type | Missing Count | Missing % | Distinct Values | Variable Role & Description |
|---|---|---|---|---|---|
productType |
Categorical (object) |
0 | 0.000% | 12 | Product category descriptor. |
brandDesc |
Categorical (object) |
0 | 0.000% | 12 | Brand name identifier. |
avgGbpPrice |
Numeric (float64) |
34,626 | 34.626% | 6,385 | Average item selling price in GBP. |
avgDiscountValue |
Numeric (float64) |
34,626 | 34.626% | 1,143 | Average discount value applied. |
yearOfBirth |
Numeric (float64) |
5,153 | 5.153% | 102 | Customer birth year. |
isMale |
Binary (float64) |
5,153 | 5.153% | 3 | Gender indicator (1 = Male, 0 = Female/Unknown). |
shippingCountry |
Categorical (object) |
0 | 0.000% | 10 | Destination country code. |
premier |
Binary (float64) |
5,153 | 5.153% | 3 | Premier membership status indicator. |
isReturned |
Binary (int64) |
0 | 0.000% | 2 | Target Variable (1 = Returned, 0 = Kept). |
Data Quality & Structural Missingness Findings:
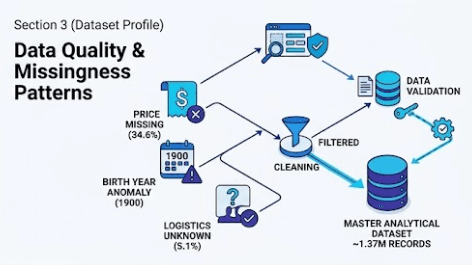
Co-Occurring Missingness: Missing values in
avgGbpPriceandavgDiscountValue(34.626%) strictly coincide with records whereproductType = UnknownandbrandDesc = Unknown. Missing customer demographic fields (5.153%) strictly align withshippingCountry = Unknown. This structure indicates systemic logging patterns rather than missing completely at random (MCAR) noise.Business Definition Anomaly: In 27,355 records (27.355%),
avgDiscountValueexceedsavgGbpPrice. As a result, derived discount percentage features were avoided until formal business definitions can be established.Placeholder Demographics: Customer birth years contain placeholder values, including 1,405 records set to 1900 and 1,439 records below 1920.
4. Comprehensive Exploratory Data Analysis
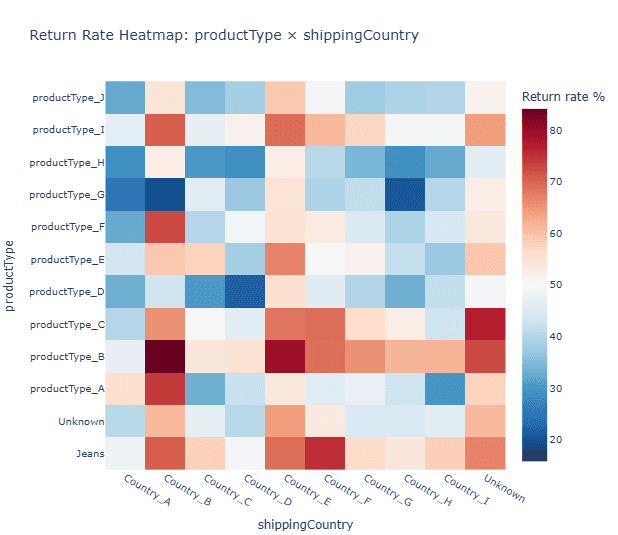
Exploratory data analysis on the balanced 100,000-row sample (50,000 returns, 50,000 non-returns) demonstrated substantial variability in return rates across key product, country, and price dimensions.
Product Category & Brand Return Dynamics
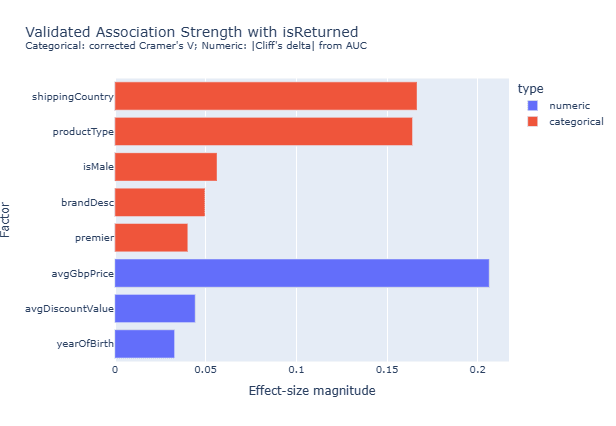
Product categories with tight fit specifications exhibit substantially higher return rates. productType_B registered the highest rate at 68.16%, followed by Jeans at 61.05%. Conversely, loose-fitting or non-apparel items such as productType_H demonstrated lower return rates (38.39%).
| Product Type Category | Total Sample Records | Return Count | Observed Return Rate (%) |
|---|---|---|---|
productType_B |
10,198 | 6,951 | 68.16% |
Jeans |
5,707 | 3,484 | 61.05% |
productType_C |
1,593 | 948 | 59.51% |
productType_I |
2,926 | 1,737 | 59.36% |
productType_E |
2,228 | 1,178 | 52.87% |
Unknown |
34,626 | 17,331 | 50.05% |
productType_A |
1,655 | 807 | 48.76% |
productType_F |
1,533 | 698 | 45.53% |
productType_G |
1,620 | 718 | 44.32% |
productType_D |
2,053 | 897 | 43.69% |
productType_J |
30,703 | 13,271 | 43.22% |
productType_H |
5,158 | 1,980 | 38.39% |
Brand-level analysis revealed similar variance. Top-tier return rate brands included Brand_C (56.78%), Pull&Bear (55.17%), and Brand_J (54.30%), whereas Brand_G posted a lower return rate of 41.60%.
Shipping Country & Price Decile Patterns
Geographical shipping destinations showed severe divergence in return propensity. Country_E and Country_B exhibited return rates of 63.78% and 61.74%, respectively, while Country_A recorded a 37.80% return rate.
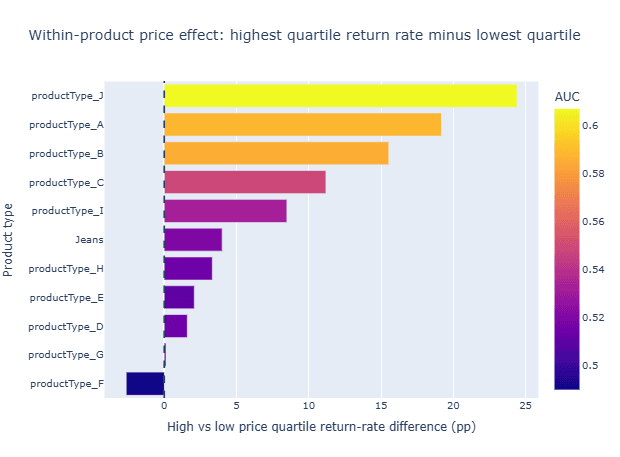
Price decile analysis demonstrated a positive correlation between higher item prices and return probability. In test evaluations, items in the lowest price decile (£1.73–£9.64) experienced an observed return rate of 33.90%, whereas items in the highest price decile (£37.15–£360.00) reached a return rate of 60.93%.
Price Decile vs. Return Rate Progression:
Low Price (£1.73 - £9.64) : [=== 33.90% =]
Mid Price (£16.77 - £19.63) : [==== 51.80% ]
High Price (£37.15 - £360.00) : [=== 60.93% =========]
High-Risk & Low-Risk Interaction Segments
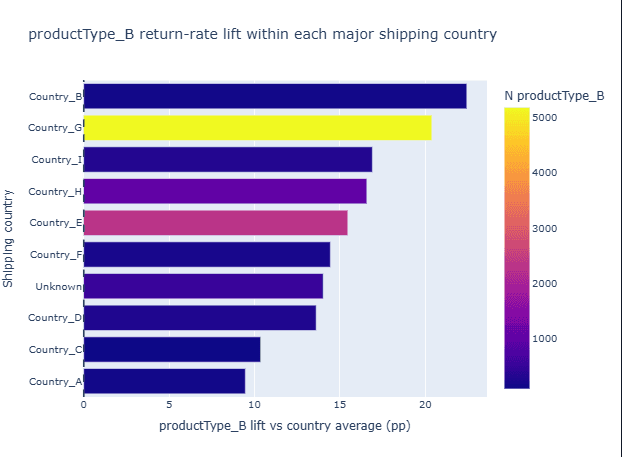
To move beyond single-variable evaluations, multi-variable interactions (minimum 500 records) were calculated. Specific combinations exhibit extreme return concentration:
| Interaction Segment | Total Row Count | Observed Return Rate (%) | Risk Level Category |
|---|---|---|---|
productType_B x Country_E |
2,308 | 79.25% | High Risk Segment |
productType_B x Brand_B |
3,838 | 71.03% | High Risk Segment |
productType_I x Country_E |
716 | 69.27% | High Risk Segment |
Jeans x Country_E |
1,757 | 69.15% | High Risk Segment |
productType_B x Country_G |
5,181 | 65.49% | High Risk Segment |
productType_H x Country_G |
2,775 | 34.27% | Low Risk Segment |
productType_J x Country_A |
556 | 32.37% | Low Risk Segment |
5. Machine Learning Methodology & Performance Evaluation
The modeling task was framed as binary classification to predict the probability that a purchase (isReturned = 1) will be returned using attributes available at prediction time. Logistic Regression was selected due to business requirements for high model interpretability, fast inference time, and low operational overhead. Strict leakage controls were maintained by withholding target-derived return rate metrics and isolating test-side datasets.
The model was trained on 1,095,306 records from the master dataset and evaluated on a reserved held-out test set of 273,827 records.
| Metric | Score | Detailed Performance Interpretation |
|---|---|---|
| ROC-AUC | 0.6431 | Demonstrates moderate discrimination power across decision thresholds. |
| PR-AUC | 0.6793 | Evaluates precision-recall trade-offs effectively on skewed outcomes. |
| Accuracy | 0.6049 | Proportion of total purchases correctly classified at the 0.50 threshold. |
| Precision | 0.6204 | Out of all flagged high-risk purchases, 62.04% were actual returns. |
| Recall | 0.7355 | Successfully captures 73.55% of all actual return occurrences. |
| F1 Score | 0.6731 | Harmonic mean reflecting the balance between precision and recall. |
Confusion Matrix & Threshold Analysis
At a standard decision threshold of 0.50, the confusion matrix performance on the 273,827 held-out test dataset is structured as follows:
| Actual Class | Predicted: 0 (Keep) | Predicted: 1 (Returned) |
|---|---|---|
| Actual: 0 (Keep) | True Negative: 54,244 | False Positive: 68,137 |
| Actual: 1 (Returned) | False Negative: 40,065 | True Positive: 111,381 |
While a threshold of 0.50 captures 111,381 true returns, it incurs 68,137 false positives. In an e-commerce operational setting, false positives (flagging a keep as a return) and false negatives (failing to flag a return) carry asymmetric financial costs. Consequently, the 0.50 threshold must be adjusted based on specific operational cost functions prior to live deployment.
6. Product Architecture & Deployment Design
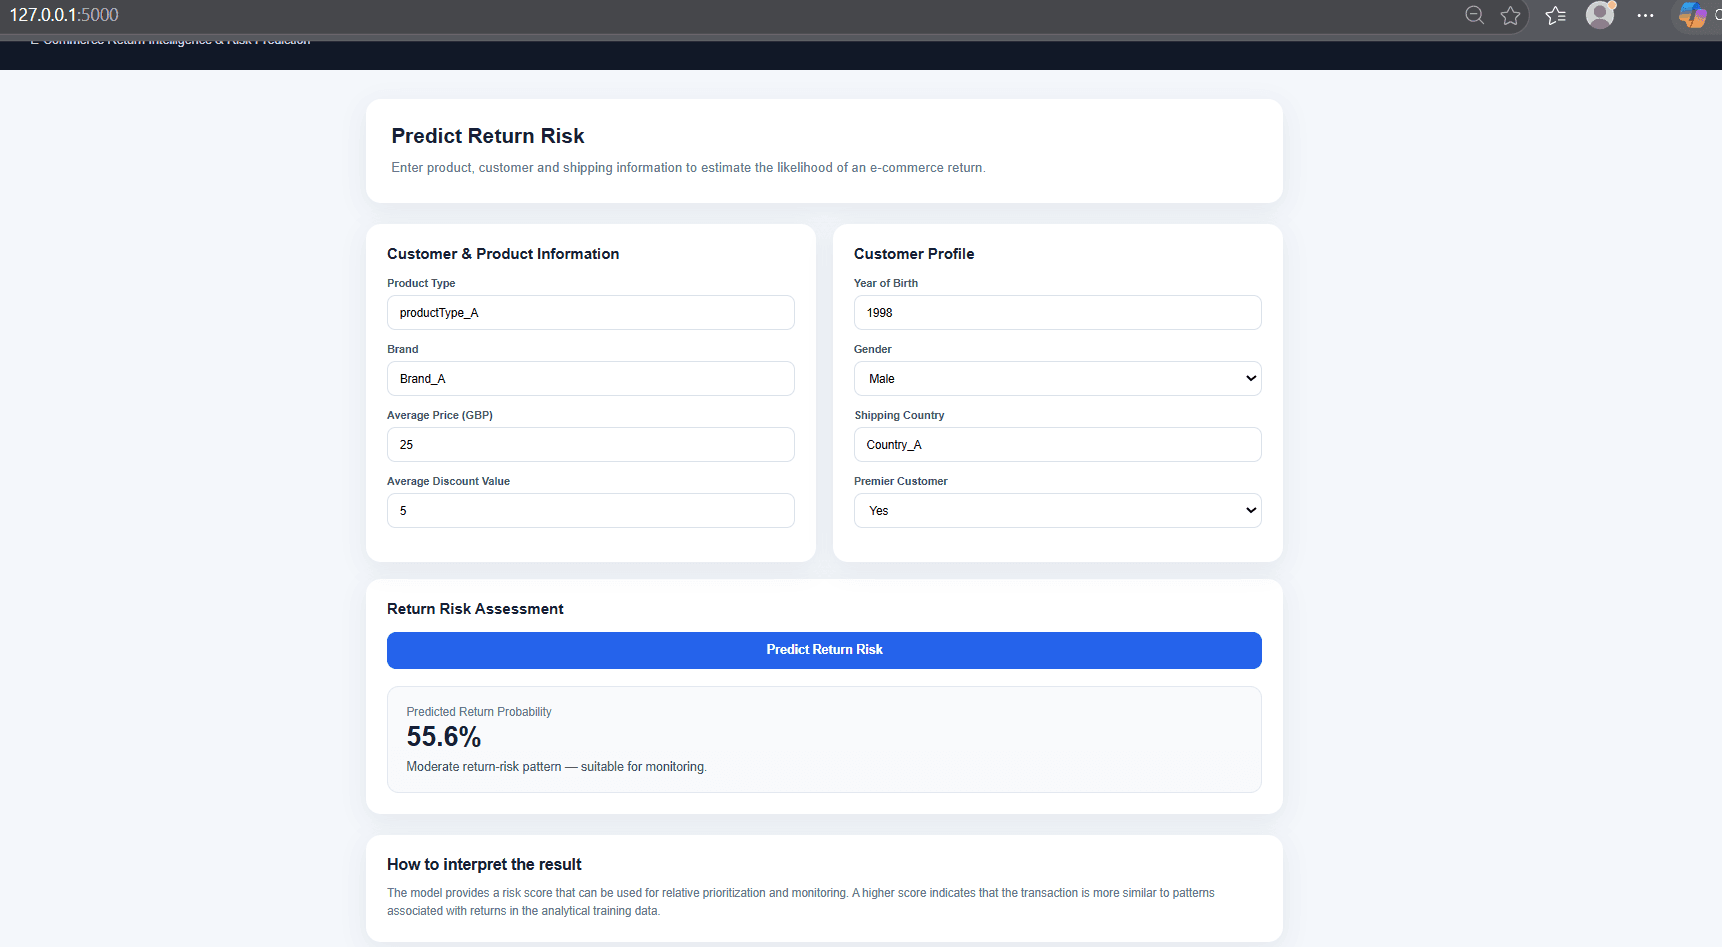
The system was packaged into a lightweight, deployable microservice architecture utilizing Python and Flask. The web application serves an interactive user interface for manual risk lookup and exposes REST API endpoints for downstream integration.
| System Component | Component Role & Description | Connections & Flow |
|---|---|---|
| Browser UI (Inputs Form) | Front-end web interface for submitting transaction attributes. | Sends input data to and receives prediction results back from the Flask REST API. |
| Flask REST API (Validation Engine) | Backend service validating requests and routing model calls. | Communicates bidirectionally with the Browser UI, passes inputs to the Trained Logistic Regression Pipeline, and exposes the System Health Endpoint. |
| Trained Logistic Regression Pipeline | Machine learning inference engine processing features and outputting probabilities. | Receives validated inputs from and returns predictions to the Flask REST API. |
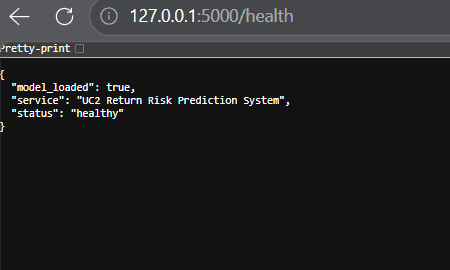
System Health Endpoint (/health) |
Monitoring route for checking backend service status. | Managed directly by the Flask REST API. |
Modular Pipeline Architecture
- Input Interface: Captures categorical fields (
productType,brandDesc,shippingCountry), numeric parameters (avgGbpPrice,avgDiscountValue,yearOfBirth), and binary indicators (isMale,premier). - Model Processing Layer: Loads pre-trained scikit-learn Logistic Regression pipelines, handles missingness transformations, and executes inference.
- Interpretation Mapping: Transforms raw output probabilities into qualitative operational categories (e.g., a score of 55.6% maps to "Moderate return-risk pattern suitable for monitoring").
- Health Endpoint Verification: Exposes a verification endpoint (
/health) returning model loading status (model_loaded = true) for infrastructure monitoring.
7. Business Impact, Strategic Roadmap & Limitations
Practical Business Applications
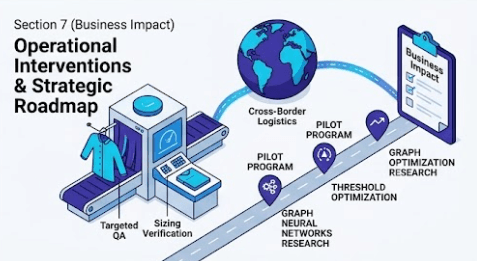
Targeted Merchandising & Sizing Reviews: E-commerce teams can focus sizing optimization and product information enhancements on high-risk product-country segments (e.g.,
productType_Bshipped toCountry_E).Logistics & Inventory Planning: Supply chain teams can adjust safety stock and return-processing staffing levels based on projected return volumes.
Policy & Operations: International logistics teams can investigate cross-border policy friction in destination countries displaying high return baselines.
Project Limitations
Moderate Predictive Power: An ROC-AUC of 0.6431 indicates the model is suitable for relative risk ranking and monitoring rather than fully automated, deterministic actions.
Data Granularity: The dataset lacks explicit order-line identifiers, customer transaction histories, and exact temporal timestamps, limiting advanced time-series modeling.
Uncertain Business Definitions: Fields such as
avgDiscountValuerequire further business domain verification due to values exceeding list prices.
Future Engineering Roadmap
- Probability Recalibration: Recalibrate raw model probabilities against real-world production prevalence.
- Threshold Optimization: Conduct explicit cost-benefit optimizations to determine optimal decision thresholds per product category.
- Graph Neural Networks: Research graph-based algorithms (GNNs) on customer-product graph interactions as a secondary research track.
8. References
McGowan, J., Guest, E., Yan, Z., Zheng, C., Patel, N., Cusack, M., Donaldson, C., de Cnudde, S., Facini, G., & Dzogang, F. A Dataset for Learning Graph Representations to Predict Customer Returns in Fashion Retail. FashionXRecSys 2022 / Lecture Notes in Electrical Engineering, 2023. DOI: 10.1007/978-3-031-22192-7_6.
ASOS GraphReturns Dataset, OSF Repository Identifier
c793h.Terno AI Agentic Data Science Platform. Project Analysis & Evaluation Case Study Outputs, 2026.
Scikit-learn Documentation: Logistic Regression Pipelines & Model Metrics Evaluation.
Flask Documentation: Python Web Framework for Model Deployment.

10 September 2026
Designing CertusAI: A Compliance-First Enterprise LLM Platform for Regulated Industries
As enterprise adoption pivots from raw model parameter scale to verifiable trust, CertusAI introduces a compliance-first LLM architecture engineered specifically for highly regulated industries. By integrating real-time PII redaction, deterministic policy enforcement, and cryptographically signed audit chains directly into the inference pipeline, CertusAI unlocks agentic AI productivity while ensuring total data sovereignty and statutory compliance.

10 September 2026
Optimizing Schedule Integrity via Patient Appointment Intelligence
Most patient no-show models look impressive on paper until they hit production. By rejecting target leakage, confronting a heavy 90/10 class imbalance head-on, and moving beyond raw accuracy, we built a production-ready decision layer that converts raw risk probabilities into actionable clinical interventions.

10 September 2026
Global Food Loss Intelligence: Strategic Screening & Decision Framework
An executive decision-support whitepaper translating the official FAO Food Loss Index (SDG Indicator 12.3.1a) into actionable intelligence for 2021–2023. This study establishes a data-driven monitoring baseline across major commodity groups, identifying Fruits & Vegetables (3-year mean index of 109.65) as the primary priority for diagnostic follow-up while offering structured strategies for public policy, industry benchmarking, and evidence-based resource allocation.