
Executive Summary
Account takeover (ATO) — where an attacker gains control of a legitimate user's session using stolen or compromised credentials — is a distinct threat from transaction-level card fraud, yet financial institutions frequently conflate the two. Transaction-level fraud detection models look for anomalous individual transactions against a population baseline; ATO instead requires identifying when a session itself deviates from a specific user's own established behavior, often before a transaction is even attempted.
This article documents the design, build, and validation of an ATO Early Warning AI Agent, developed end-to-end on the Terno AI platform. The agent establishes a per-user behavioral baseline from login timing, transaction amount, session duration, device, and location patterns, then scores incoming sessions against that baseline using a combination of a Mahalanobis-inspired deviation score and an Isolation Forest anomaly model trained exclusively on normal behavior. Flagged sessions receive a tiered alert (Low/Medium/High) accompanied by a plain-English explanation identifying which specific behavioral signals triggered the alert.
Because no usable real-world ATO session dataset was available — the CERT Insider Threat dataset's Kaggle (r6.2) and CMU Figshare (r4.2) releases proved version-incompatible for this purpose — a custom synthetic dataset was generated using a principle-grounded parameter design: distributional assumptions were seeded from general, publicly available reference points (e.g., published CERT-style synthetic dataset methodology, RBI's FY2023–24 annual report for transaction-value context, and published mobile session-duration literature) rather than derived through precise statistical fitting to a real population. This framing — and its limitations — are discussed transparently in this document, including a known gap between the dataset's assumed ~45-minute normal session duration and real banking session durations (typically ~3–6 minutes), and a formal six-test statistical validation suite that surfaced both supporting and limiting evidence for the dataset's realism.
Key results on the held-out synthetic test set (60,000 sessions across 1,000 users, days 120–179, 522 injected attack sessions):
| Metric | Value |
|---|---|
| Precision | 0.9126 |
| Recall | 1.0000 |
| F1 Score | 0.9543 |
| AUC-ROC | 1.0000 |
| False Positive Rate | 0.0008 |
| False Negative Rate | 0.0000 |
All 522 injected attack sessions were correctly flagged as Medium or High alert (0 false negatives), with only 50 false positives out of 59,478 normal sessions.
These results demonstrate that the detection pipeline is architecturally sound and the modeling approach is viable. They do not by themselves demonstrate real-world production reliability — the synthetic data's known statistical limitations (discussed in Sections 6 and 8) mean the appropriate next step is shadow deployment against real session data rather than direct production rollout. This document is intended for technical and managerial stakeholders evaluating the maturity of the ATO detection approach and the evidentiary basis for its next-phase investment.
1. Introduction
1.1 Background
Financial institutions have historically concentrated fraud detection investment on transaction-level fraud — flagging anomalous individual payments against population-wide spending patterns (card-not-present fraud, unusual merchant categories, velocity checks, and similar signals). This is a mature discipline with well-established tooling.
Account takeover (ATO) is a related but structurally different threat. In an ATO attack, a bad actor has already obtained valid credentials (via phishing, credential stuffing, malware, or a data breach) and is operating as the legitimate user. The fraudulent activity begins at the point of session access, not at the point of transaction — meaning a detection system that waits for a suspicious transaction to occur is, by definition, already too late for early warning. Effective ATO detection instead requires modeling how an individual behaves — their typical login hours, devices, cities, transaction sizes, and session lengths — and flagging sessions where that specific user's own pattern is violated, independent of whether the broader population would find the session normal.
1.2 Importance of the Problem
Because ATO precedes rather than coincides with fraudulent transactions, it represents an opportunity for pre-transaction intervention — step-up authentication, session termination, or analyst review — that transaction-level systems structurally cannot offer. Distinguishing ATO detection from transaction fraud detection is therefore not a semantic exercise; it determines what data is modeled (identity/session-level vs. population/transaction-level), what "normal" means (a single user's history vs. a population distribution), and when in the user journey detection can act (pre-transaction vs. post-initiation).
1.3 Scope of This Document
This article covers:
The problem framing and its distinction from transaction-level fraud detection
The rationale, construction, and known limitations of the custom synthetic dataset used to prototype the agent
The system architecture and modeling approach (per-user baselining, Mahalanobis-inspired scoring, Isolation Forest, combined risk scoring, alert tiering, and explanation generation)
Full evaluation results on the held-out synthetic test set
A rigorous statistical validation of the synthetic dataset itself, including where it does and does not resemble real financial behavioral data
Explicitly acknowledged limitations and the recommended path to real-world validation (shadow deployment)
A roadmap for maturing the prototype toward production readiness
This document does not claim production-grade validation. Its purpose is to present a defensible, evidence-backed account of what has been built, what it demonstrates, and what remains to be proven.
2. Problem Statement
2.1 Current Workflows
Most financial institutions handle account-level and payment-level risk through two loosely connected layers:
Perimeter/access controls — password policies, MFA prompts, device/IP reputation lists, and geo-velocity rules applied at login or session start.
Transaction monitoring — rule-based and ML-based systems that score individual payments against population-level fraud patterns (unusual merchant category, amount, geography relative to all customers, not the specific customer).
ATO risk is typically addressed as a byproduct of these two layers rather than as its own detection object. A session that would look completely unremarkable to a population-level transaction model (a modest, plausible transaction amount, from a device type the bank sees constantly) can still represent a takeover if it is wildly inconsistent with that specific user's history.
2.2 Pain Points and Limitations
Conflation with transaction fraud. ATO is frequently modeled using the same population-level techniques built for card fraud, which are built to answer a different question ("is this transaction unusual for customers like this one?") rather than the ATO question ("is this session unusual for this customer?").
Static, rule-based access controls. Device/IP blacklists and geo-velocity thresholds are reactive and easily learned or evaded by attackers who use residential proxies or previously-unflagged devices.
Detection point occurs too late. Because monitoring is concentrated at the transaction layer, a takeover session can persist — browsing account details, changing contact information, or setting up mule transfers — well before any transaction trips a rule.
Analyst alert fatigue. Static thresholds tuned for population-wide sensitivity generate high false-positive volumes, and analysts lack a plain-English basis for triaging alerts quickly.
2.3 Real-World Implications
Delayed ATO detection increases the window during which an attacker can exfiltrate funds, harvest further personal data, or stage a larger fraud (e.g., mule account setup) before any control intervenes. It also shifts cost downstream — to reactive investigation and reimbursement — rather than upstream, to session-level prevention.
3. Existing Approaches and Limitations
3.1 Traditional Tools and Manual Workflows
Rule-based access controls: static thresholds on login geography, device recognition, and time-of-day, generally applied uniformly across the customer base rather than personalized per user.
Population-level transaction fraud models: supervised or rule-based systems trained to detect anomalies relative to the overall customer population or merchant category, not the individual account holder.
Manual fraud operations review: human analysts triaging alerts, frequently with limited automated explanation of why a session was flagged, requiring manual investigation of raw logs.
3.2 Limitations of Current Approaches
- Security risk : Static rules are learnable and evadable by attackers who study institutional thresholds over time.
- Performance bottlenecks : Manual review does not scale with transaction/session volume, and population-level models are not built to answer per-user questions in real time.
- Cost : Large fraud operations teams and high false-positive volumes increase headcount and review cost.
- Complexity : Institutions accumulate large, difficult-to-maintain rule sets over time, with limited visibility into which rules are still effective.
- Explainability gap : Existing systems often surface a risk score without a plain-English rationale, slowing analyst triage and complicating regulatory justification.
These limitations motivate a session-level, per-user behavioral baselining approach — the subject of the remainder of this document.
4. Proposed Solution: Terno AI
4.1 Overview of Terno AI
Terno AI is a data science execution platform that allows a user to provide a dataset and a problem statement and receive an end-to-end model pipeline in return. Rather than requiring a separate local environment, notebook server, and manually assembled toolchain, Terno AI executes Python directly, trains ML models, connects to databases, generates SQL, and produces visualizations within a single conversational workflow — with every step's code, intermediate output, and generated artifact retained and inspectable.
For this project, that translated into an iterative, prompt-by-prompt build process: each stage of the pipeline (data profiling, feature engineering, model training, scoring, evaluation, explanation generation, and statistical validation) was specified as a discrete, scoped prompt, executed, verified against its stated output, and only then built upon in the next step. This produced a fully auditable trail from raw dataset to final evaluated model — every transformation is traceable to the exact instruction that produced it.
4.2 Key Capabilities Used
Python execution with persistent workspace outputs — every intermediate artifact (baselines, train/test splits, feature tables, scored datasets) was saved to a dated output directory and could be reloaded by subsequent prompts without re-deriving it.
In-platform ML model training — scikit-learn's Isolation Forest was trained and scored directly within the platform, with no external environment required.
Native data visualization — Plotly-based interactive charts were generated for every distributional check, evaluation metric, and validation test, using a documented in-platform charting skill.
SQL/database connectivity — available for future integration into live transaction/session data sources as the agent matures toward production data (see Section 11).
4.3 Core Idea of the Solution
The core modeling idea is straightforward: a session is only as anomalous as it is different from that specific user's own history. Rather than training a single global model to separate "normal" from "attack" sessions across the entire population, the agent:
- Establishes a per-user behavioral baseline (mean and standard deviation of login hour, transaction amount, and session duration; most frequent device and city) from each user's own training-period sessions.
- Scores every new session against that user's own baseline, not the population average.
- Combines this personalized deviation score with a population-level Isolation Forest anomaly score, trained exclusively on normal sessions, to catch anomalies a purely personal baseline might miss.
- Converts the combined score into a tiered alert (Low/Medium/High) and a plain-English explanation identifying exactly which behavioral signals (unusual hour, unusual amount, unusual duration, new device, new city) drove the flag.
4.4 Connecting Features to Problem Resolution
| Problem (Section 2–3) | Terno AI Capability | How It Resolves the Gap |
|---|---|---|
| ATO conflated with population-level transaction fraud | Per-user baseline computation and scoring, executed natively in-platform | Detection is explicitly identity/session-level, not transaction/population-level |
| Static, evadable access rules | Isolation Forest trained on normal behavior only, combined with statistical deviation scoring | Adapts to behavioral patterns rather than fixed thresholds |
| Late detection point (post-transaction) | Session-level features (hour, device, city, duration) scored independently of transaction outcome | Detection can trigger before or independent of any transaction completing |
| Alert fatigue / low explainability | Rule-based plain-English explanation layer generated per flagged session | Analysts get an immediate, specific rationale rather than a bare score |
| Reproducibility and auditability of the build | Every pipeline stage executed as a scoped, logged prompt with saved intermediate outputs | Full traceability from raw data to final model, supporting methodological review |
5. System Architecture
5.1 Architectural Overview
The current implementation is a batch-oriented prototype pipeline, built and validated entirely within the Terno AI platform against the synthetic session dataset described in Section 6. It is structured as a sequence of discrete, auditable stages rather than a single monolithic model, so that each stage's output can be independently inspected and validated before being consumed downstream.
5.2 Components
1. Raw session store
Role: Source of truth for all session-level events
Input: —
Output:
ato_synthetic_dataset_v2.csv(180,000 sessions)
2. Train/test splitter
Role: Strict, non-shuffled temporal split preventing look-ahead leakage
Input: Raw session store
Output:
train_v2.csv(days 0–119, normal only),test_v2.csv(days 120–179)
3. User baseline engine
Role: Computes per-user behavioral statistics from the training period only
Input:
train_v2.csv(normal sessions)Output:
user_baselines_v2.csv— per-user mean/std for hour, amount, duration; modal device and city
4. Feature engineering layer
Role: Joins each test session to its user's baseline and derives deviation features
Input:
test_v2.csv+user_baselines_v2.csvOutput:
test_features_v2.csv— hour/amount/duration deviation, is_new_device, is_new_city
5. Deviation scoring module
Role: Combines the three deviation features into a single Mahalanobis-inspired anomaly score and risk score
Input:
test_features_v2.csvOutput:
test_scored_v2.csv— anomaly_score, final_risk_score, alert_level
6. Isolation Forest module
Role: Population-level anomaly model trained only on normal sessions; scores every test session independently
Input:
train_v2.csv(normal only) +test_scored_v2.csvOutput:
test_final_v2.csv— isolation_score, combined_score, combined_alert_level
7. Explanation engine
Role: Generates a plain-English, rule-based rationale for every High/Medium alert
Input:
test_final_v2.csv(flagged sessions)Output:
alert_explanations_v2.csv
8. Evaluation module
Role: Computes confusion matrix, precision/recall/F1/F2/AUC-ROC against ground truth
Input:
test_final_v2.csvOutput:
evaluation_metrics_v2.csv, ROC curve, score distribution charts
9. Dataset validation module
Role: Independently verifies the statistical properties of the synthetic dataset itself (separate from model evaluation)
Input:
ato_synthetic_dataset_v2.csv,user_baselines_v2.csvOutput:
dataset_validation_report.csv,validation_interpretation_report.txt
5.3 Data Flow
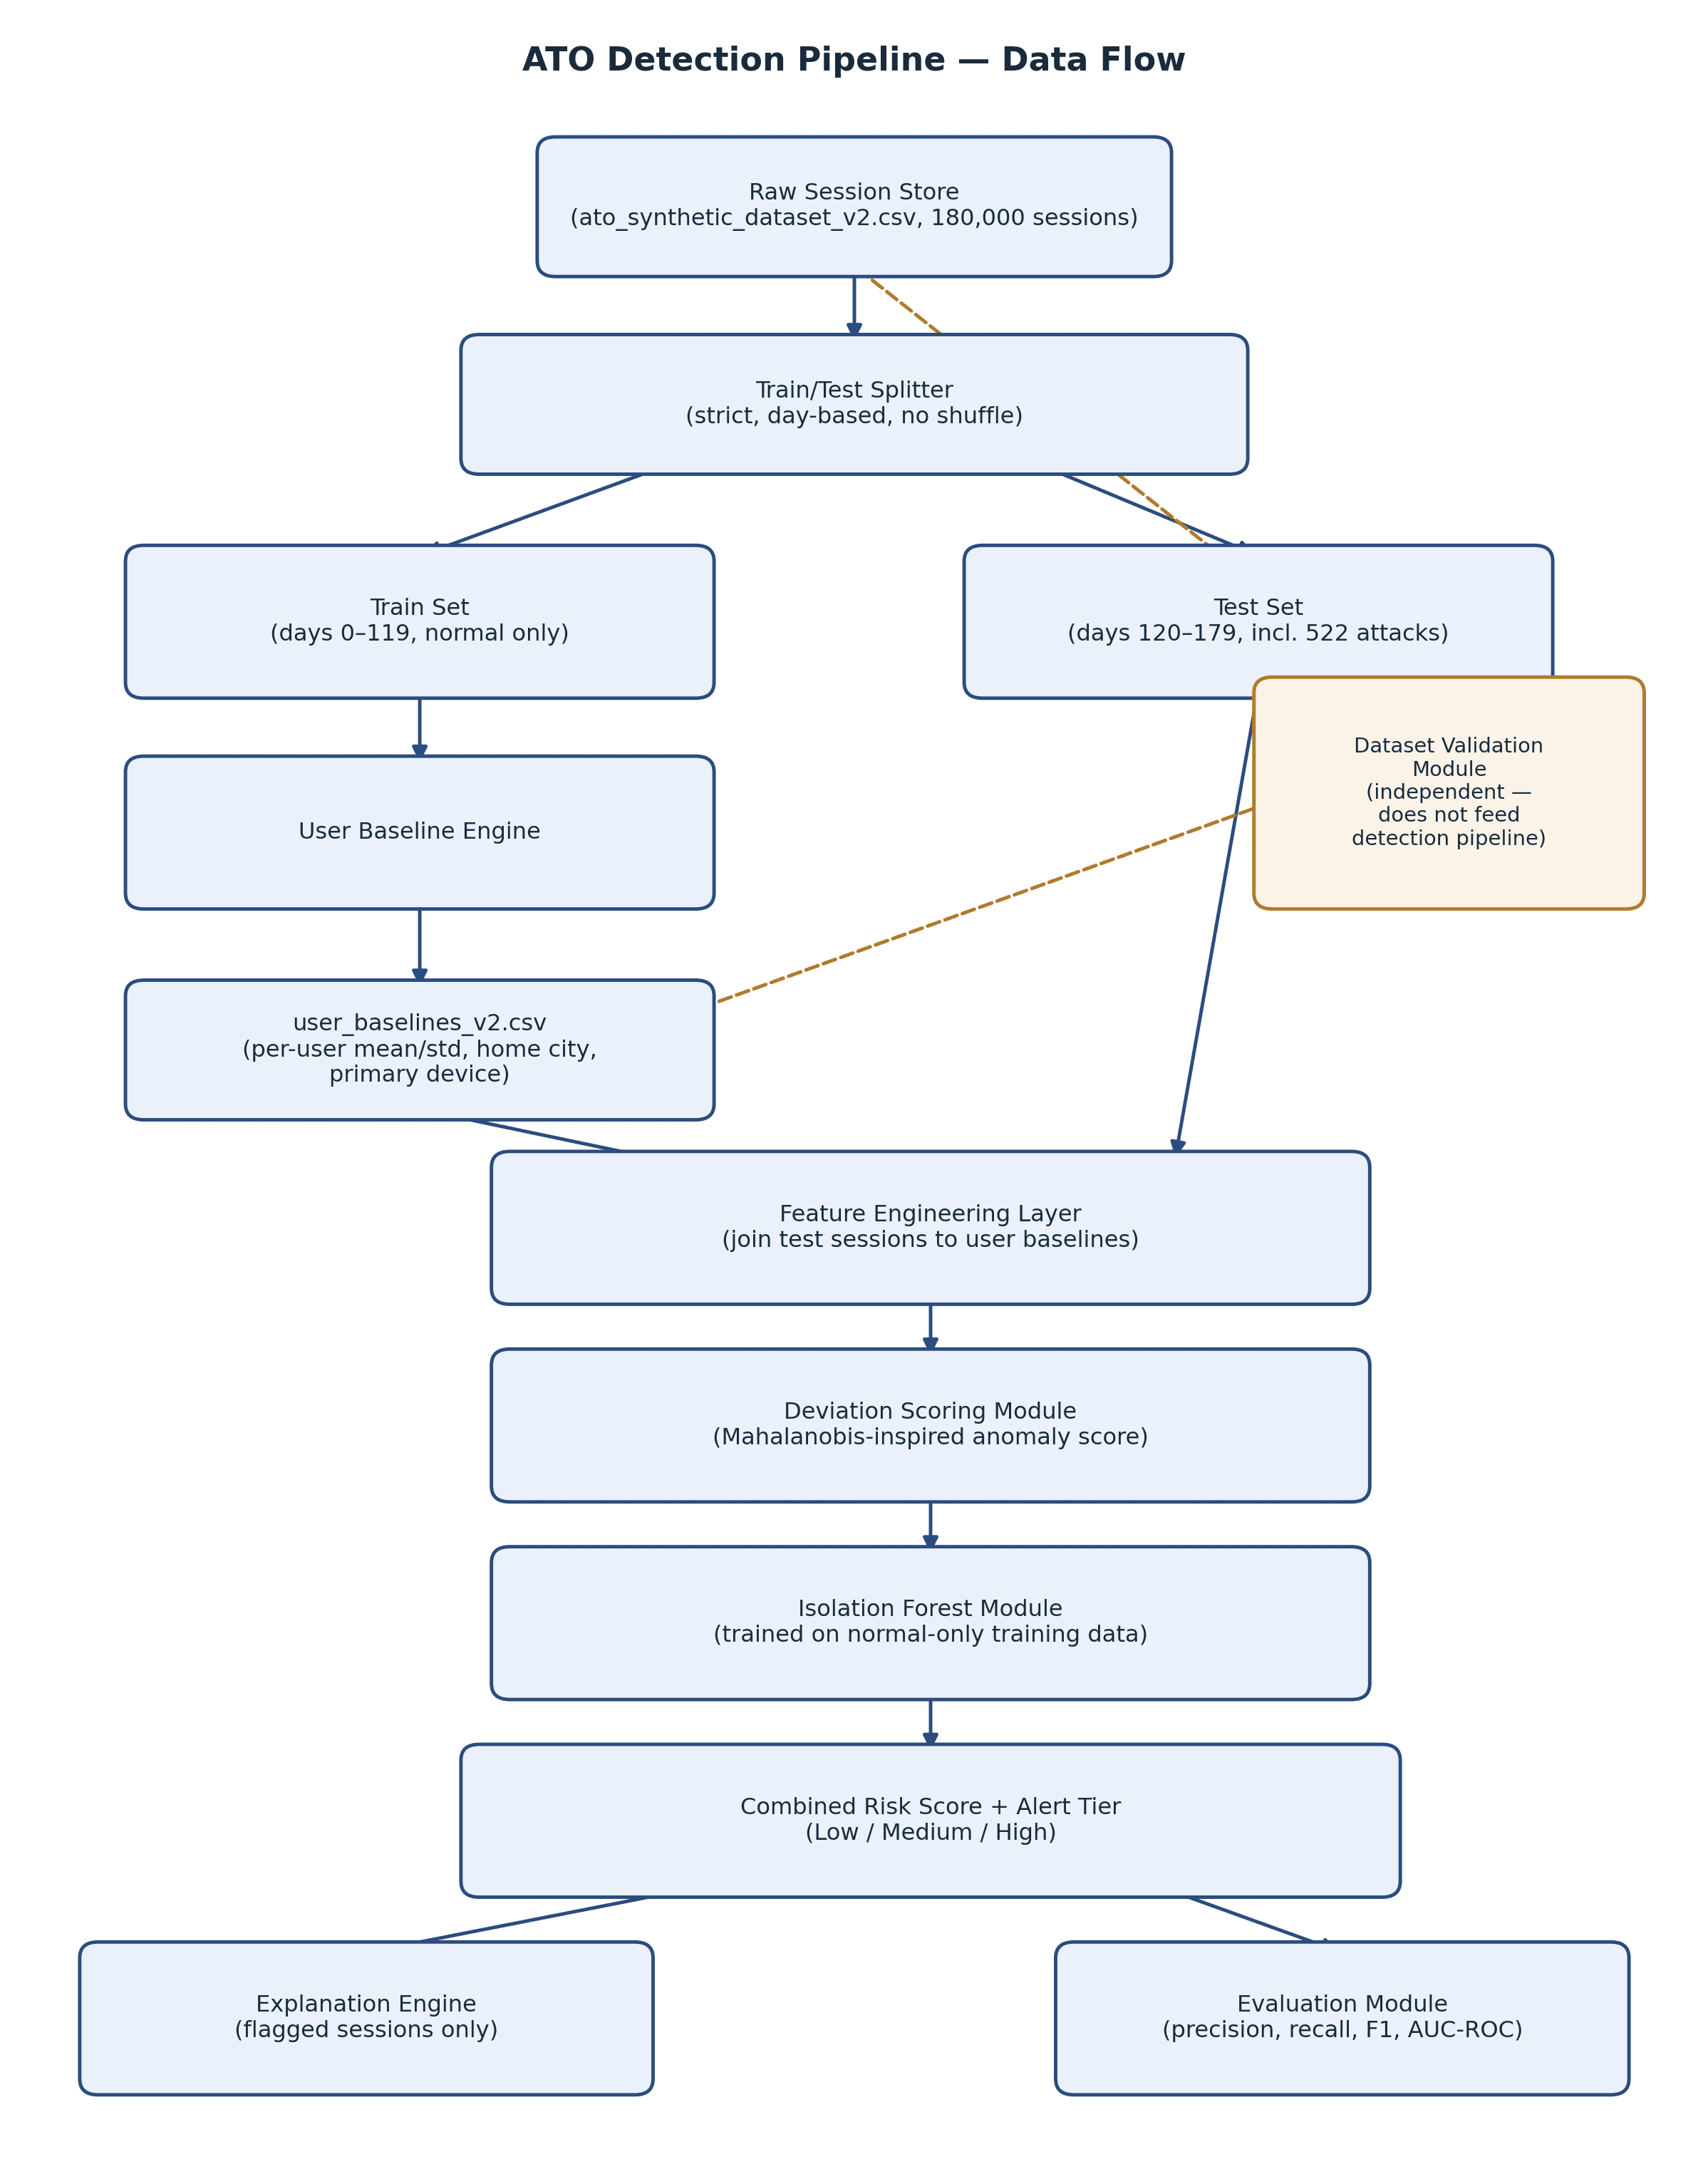
A parallel, independent branch — the Dataset Validation Module — operates directly on the raw dataset and baseline table, and does not feed into the detection pipeline. It exists purely to test whether the synthetic data itself exhibits realistic statistical properties (see Section 6.4), keeping model evaluation and dataset validation as two separate, non-conflated questions.
5.4 Deployment Setup (Current State)
The current build is a prototype/offline evaluation environment: all stages run as sequential batch jobs against static CSV snapshots within Terno AI, with no live data connection, streaming ingestion, or real-time scoring endpoint. This is appropriate for the current validation phase but is explicitly not a production deployment topology — the transition path (inline/synchronous vs. asynchronous event-streaming vs. hybrid) is discussed as future work in Section 11.
6. Implementation Details
6.1 Data Sources
The original intent was to build and validate the ATO detection agent against the CERT Insider Threat Dataset (Carnegie Mellon University), a widely referenced synthetic behavioral dataset in the insider-threat and anomaly-detection literature. In practice, the two available releases proved incompatible for this purpose:
The Kaggle release (r6.2) and the CMU Figshare release (r4.2) differ in schema and generation version, and could not be reliably reconciled into a single usable session-level dataset for this project's feature set (login timing, transaction amount, session duration, device, and city).
Glasser & Lindauer (2013), the original CERT dataset methodology paper, confirms that the CERT dataset itself is constructed from artificially designed insider-threat scenarios, not real employee data — meaning even the "real-data" alternative was itself synthetic by design, further motivating a purpose-built synthetic dataset over forcing an ill-fitting external one.
Given this, a decision was made to construct a custom synthetic dataset (ato_synthetic_dataset_v2.csv) tailored specifically to the ATO session-level detection task, rather than adapting a mismatched external dataset.
6.2 Dataset Creation Process
Design philosophy: principle-grounded parameter design. The dataset's distributional parameters (login hour patterns, transaction amount ranges, session duration, device and city assignment) were chosen to be directionally consistent with known behavioral and financial patterns, rather than statistically fitted to a real population. This is a meaningful distinction to state explicitly: the dataset does not claim to reproduce the precise statistical properties of any real institution's transaction data — it claims to embed plausible behavioral structure (individuals have consistent-but-not-identical routines; attacks look different from a given user's routine) sufficient to prototype and stress-test a detection pipeline.
Reference points used to ground parameter choices, kept directional rather than treated as precise statistical targets:
Glasser & Lindauer (2013), the CERT dataset methodology paper, as precedent that synthetic, scenario-designed datasets are an accepted basis for behavioral anomaly detection research.
RBI's FY2023–24 Annual Report, for broad context on transaction-value magnitudes relevant to an Indian retail banking setting.
Published mobile session-duration literature (Böhmer et al.; Localytics mobile usage data), for general context on typical mobile session lengths.
Structural design:
180,000 total sessions across 1,000 synthetic users over 180 days.
9 core fields:
user_id,day,hour_of_day,day_of_week,device_id,city,session_duration,transaction_amount,is_attack.Each user has an individually seeded "normal" behavioral profile (a typical login hour, typical transaction amount range, typical session duration, home city, and primary device), generating consistent-but-not-identical sessions across the 180-day window.
522 attack sessions were injected specifically into days 130–179, deliberately confined to the later portion of the timeline so that an untouched, fully "normal" training window (days 0–119) remains available for baseline construction — this produces the 343:1 class imbalance confirmed in the data overview (Section 7).
The generation script was implemented in plain Python without the Faker library, specifically to preserve cross-environment compatibility (the dataset needed to run consistently across both the Terno AI sandbox and JupyterLite, where Faker's dependency footprint had previously caused environment issues).
A known, explicitly acknowledged limitation: the dataset assumes a mean "normal" session duration of ~45 minutes (confirmed in the data overview: mean 44.9, median 45.0 minutes). Real banking app/web sessions are typically much shorter — commonly cited in the ~3–6 minute range in mobile session-length literature. This gap is not corrected in the current dataset version and is treated in this document as a stated limitation (Section 10) rather than silently absorbed — it should be corrected in any future dataset revision intended to more closely mirror real banking session behavior.
6.3 Step-by-Step Workflow
The pipeline was built as eleven sequential, independently verified prompts within Terno AI, each producing a saved intermediate artifact consumed by the next stage:
- Data overview — shape, dtypes, missing values, basic statistics, and class distribution confirmed on the raw 180,000-row dataset.
- Exploratory visualization — class imbalance (log scale), and distributions of hour-of-day, transaction amount (normal vs. attack, separately scaled), and session duration.
- User baseline computation — per-user mean/std of hour, amount, and duration, plus modal device and city, computed strictly from the training period (days 0–119, normal sessions only) to avoid any leakage of attack-period or test-period information into the baseline.
- Strict train/test split — day-based, non-shuffled, verified to have zero day overlap and zero attack sessions in the training partition.
- Feature engineering — join of test sessions to user baselines; derivation of
hour_deviation,amount_deviation,duration_deviation,is_new_device,is_new_city. - Mahalanobis-inspired deviation scoring — Euclidean combination of the three deviation features into an
anomaly_score, blended with a device/city flag into afinal_risk_score, and mapped to an initialalert_level. - Isolation Forest scoring — a 200-tree Isolation Forest (
contamination=0.01,random_state=42) trained exclusively on normal training sessions, scoring every test session on hour, amount, and duration; combined 50/50 with the deviation-based risk score into acombined_scoreandcombined_alert_level. - Evaluation — full confusion matrix, precision/recall/F1/F2, false positive/negative rates, and AUC-ROC computed against ground-truth
is_attacklabels, with ROC curve and score-distribution visualizations. - Explanation generation — rule-based, plain-English rationale generated for every High/Medium alert, citing the specific deviation(s) responsible.
- Dataset statistical validation — an independent six-test suite (Section 6.4) verifying whether the synthetic dataset itself exhibits realistic behavioral and financial statistical properties.
- Plain-English validation interpretation — a structured, non-technical interpretation of the six validation tests, with an explicit critical/non-critical threat classification for each failure, produced for stakeholder review.
6.4 Dataset Validation: Statistical Realism Testing
Because model evaluation metrics (Section 8) only measure whether the pipeline can separate synthetic attacks from synthetic normal sessions — a comparatively easy task if the synthetic generation logic makes attacks too distinct — a separate, independent validation suite was run directly against the raw dataset to test whether its normal behavior is itself statistically plausible.
Six tests were run, each against a pre-specified pass/fail threshold:
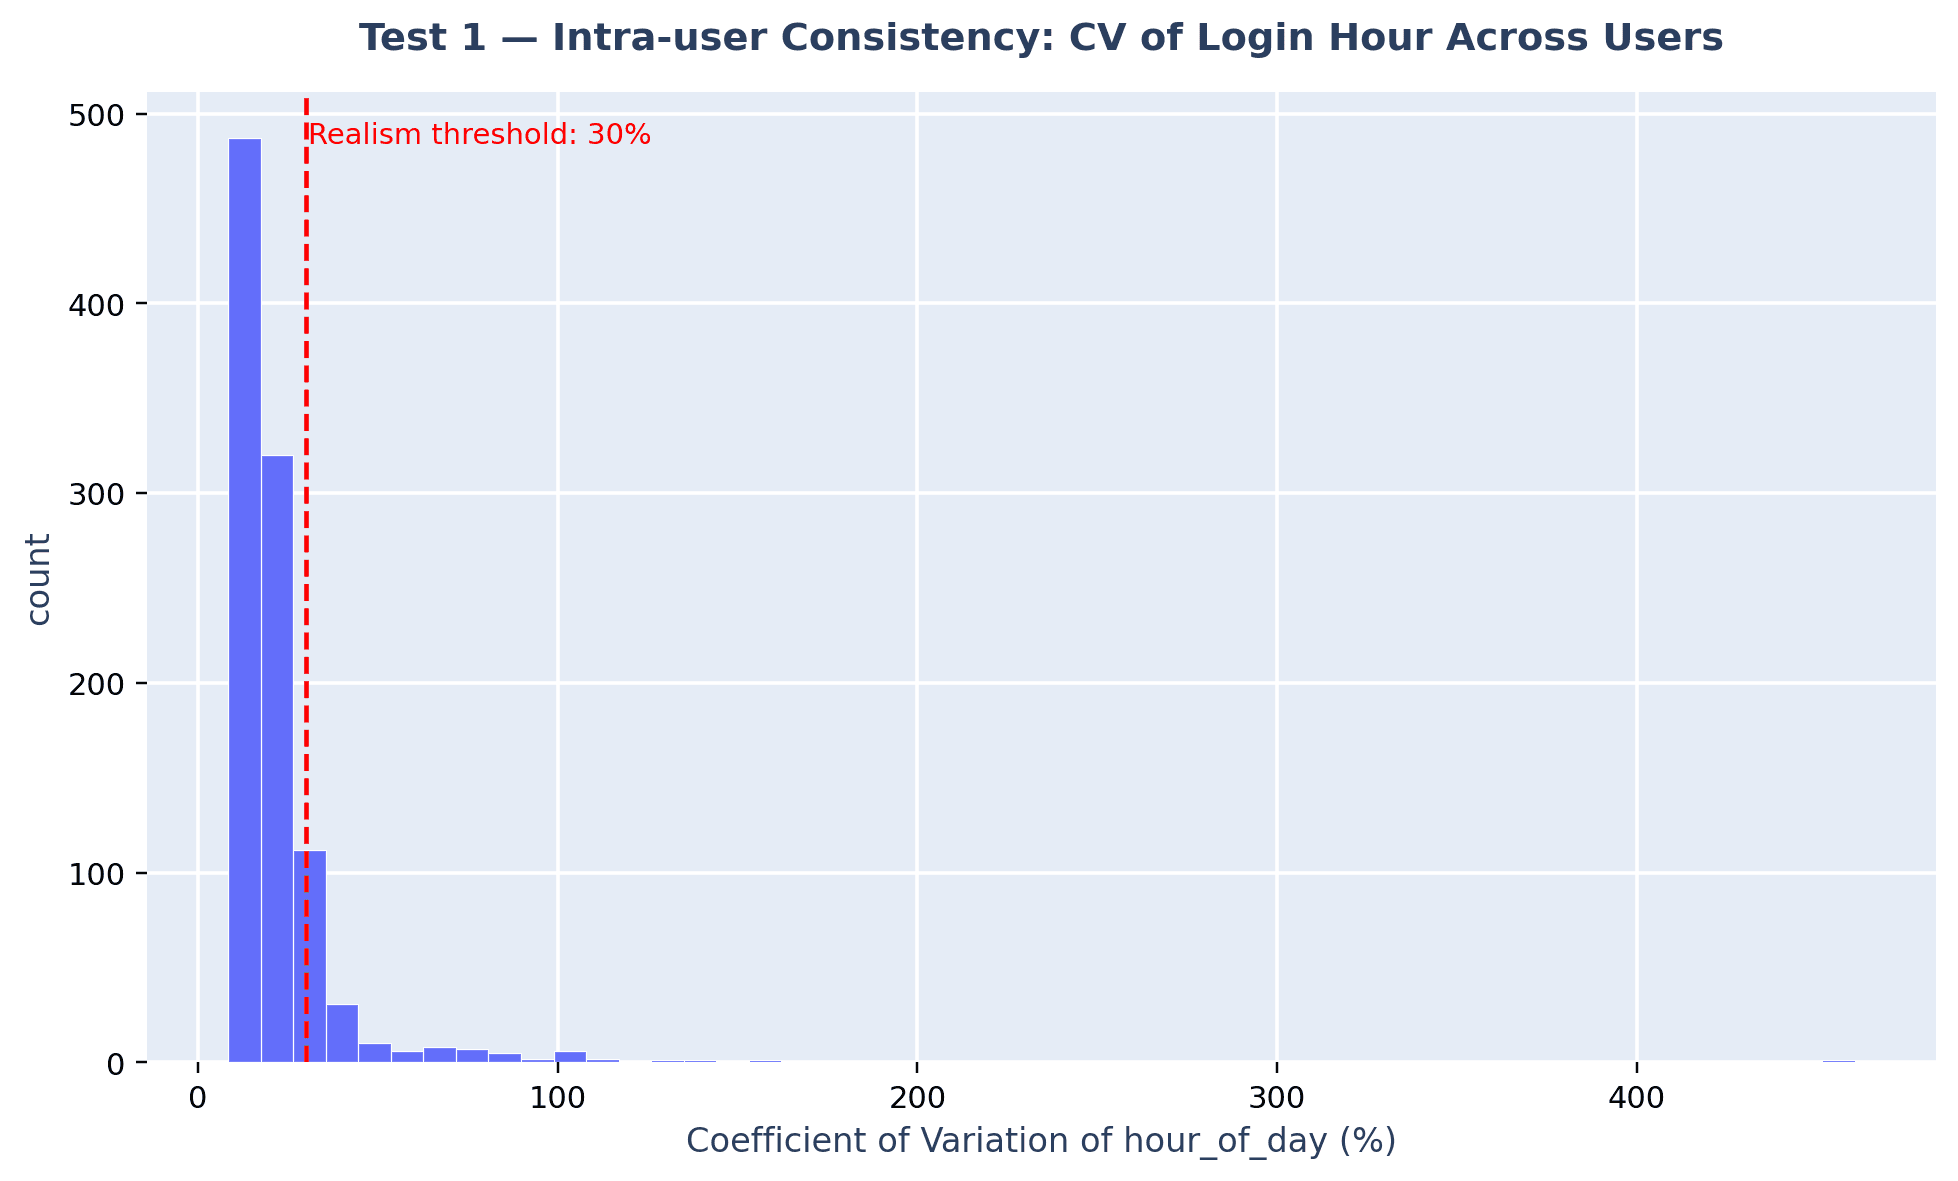
1. Intra-user consistency
What it checks: Coefficient of variation of each user's login hour (training period)
Result: Mean CV = 22.49%, median = 17.66% (threshold: <30%)
Verdict: Pass
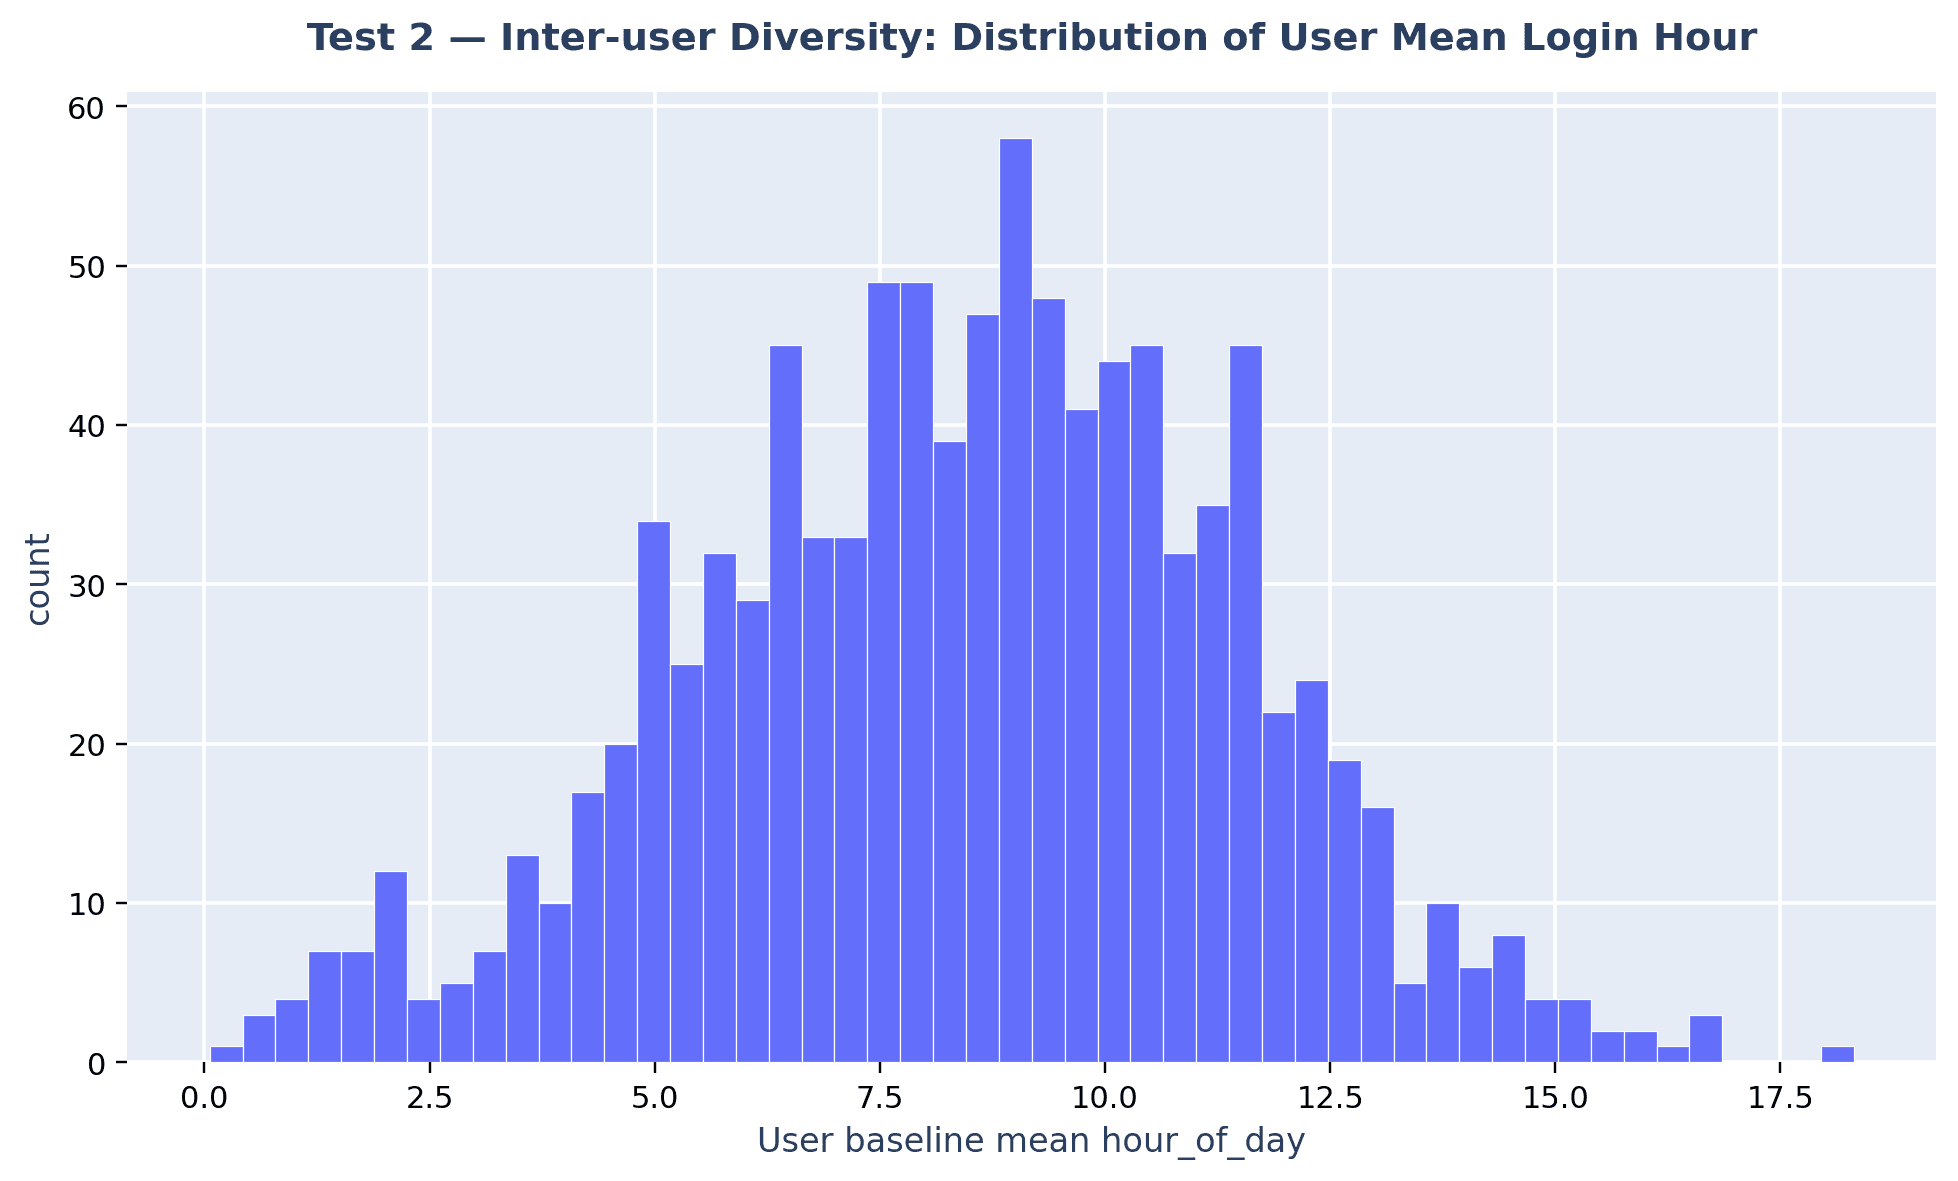
2. Inter-user diversity
What it checks: Std. deviation of mean login hour across all 1,000 users
Result: 3.02 hours (threshold: >3 hours)
Verdict: Pass
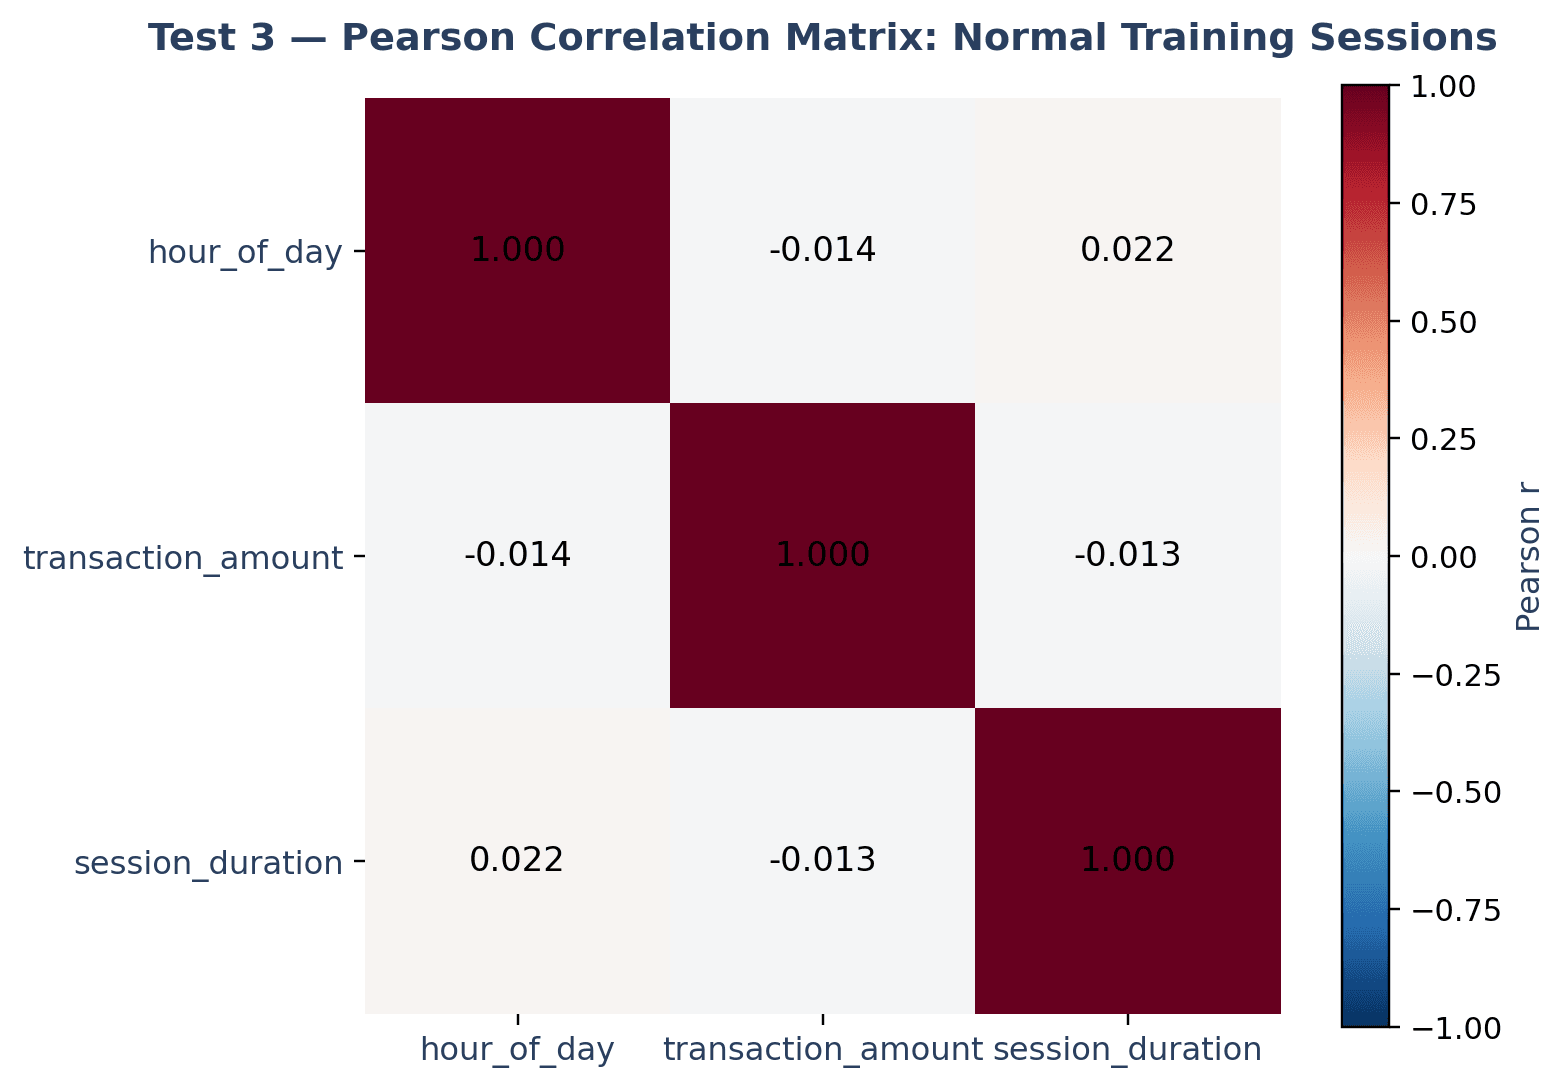
3. Feature correlation
What it checks: Pearson correlation between hour, amount, and duration (normal sessions)
Result: Max |r| = 0.022 — effectively near-zero, below the 0.05–0.3 "mild" band
Verdict: Fail
4. Log-normality of transaction amounts
What it checks: Shapiro-Wilk test on log-transformed amounts (n=5,000)
Result: p = 2.91 × 10⁻⁵⁴ (threshold: p > 0.05)
Verdict: Fail
5. Statistical separability of attacks
What it checks: Mann-Whitney U test, attack vs. normal, on all three core features
Result: All p < 0.001 (max p = 1.02 × 10⁻²⁹³)
Verdict: Pass
6. Benford's Law conformity
What it checks: Chi-square goodness-of-fit on leading digits of normal transaction amounts
Result: χ² = 116,106.31, p ≈ 0 (threshold: p > 0.05)
Verdict: Fail
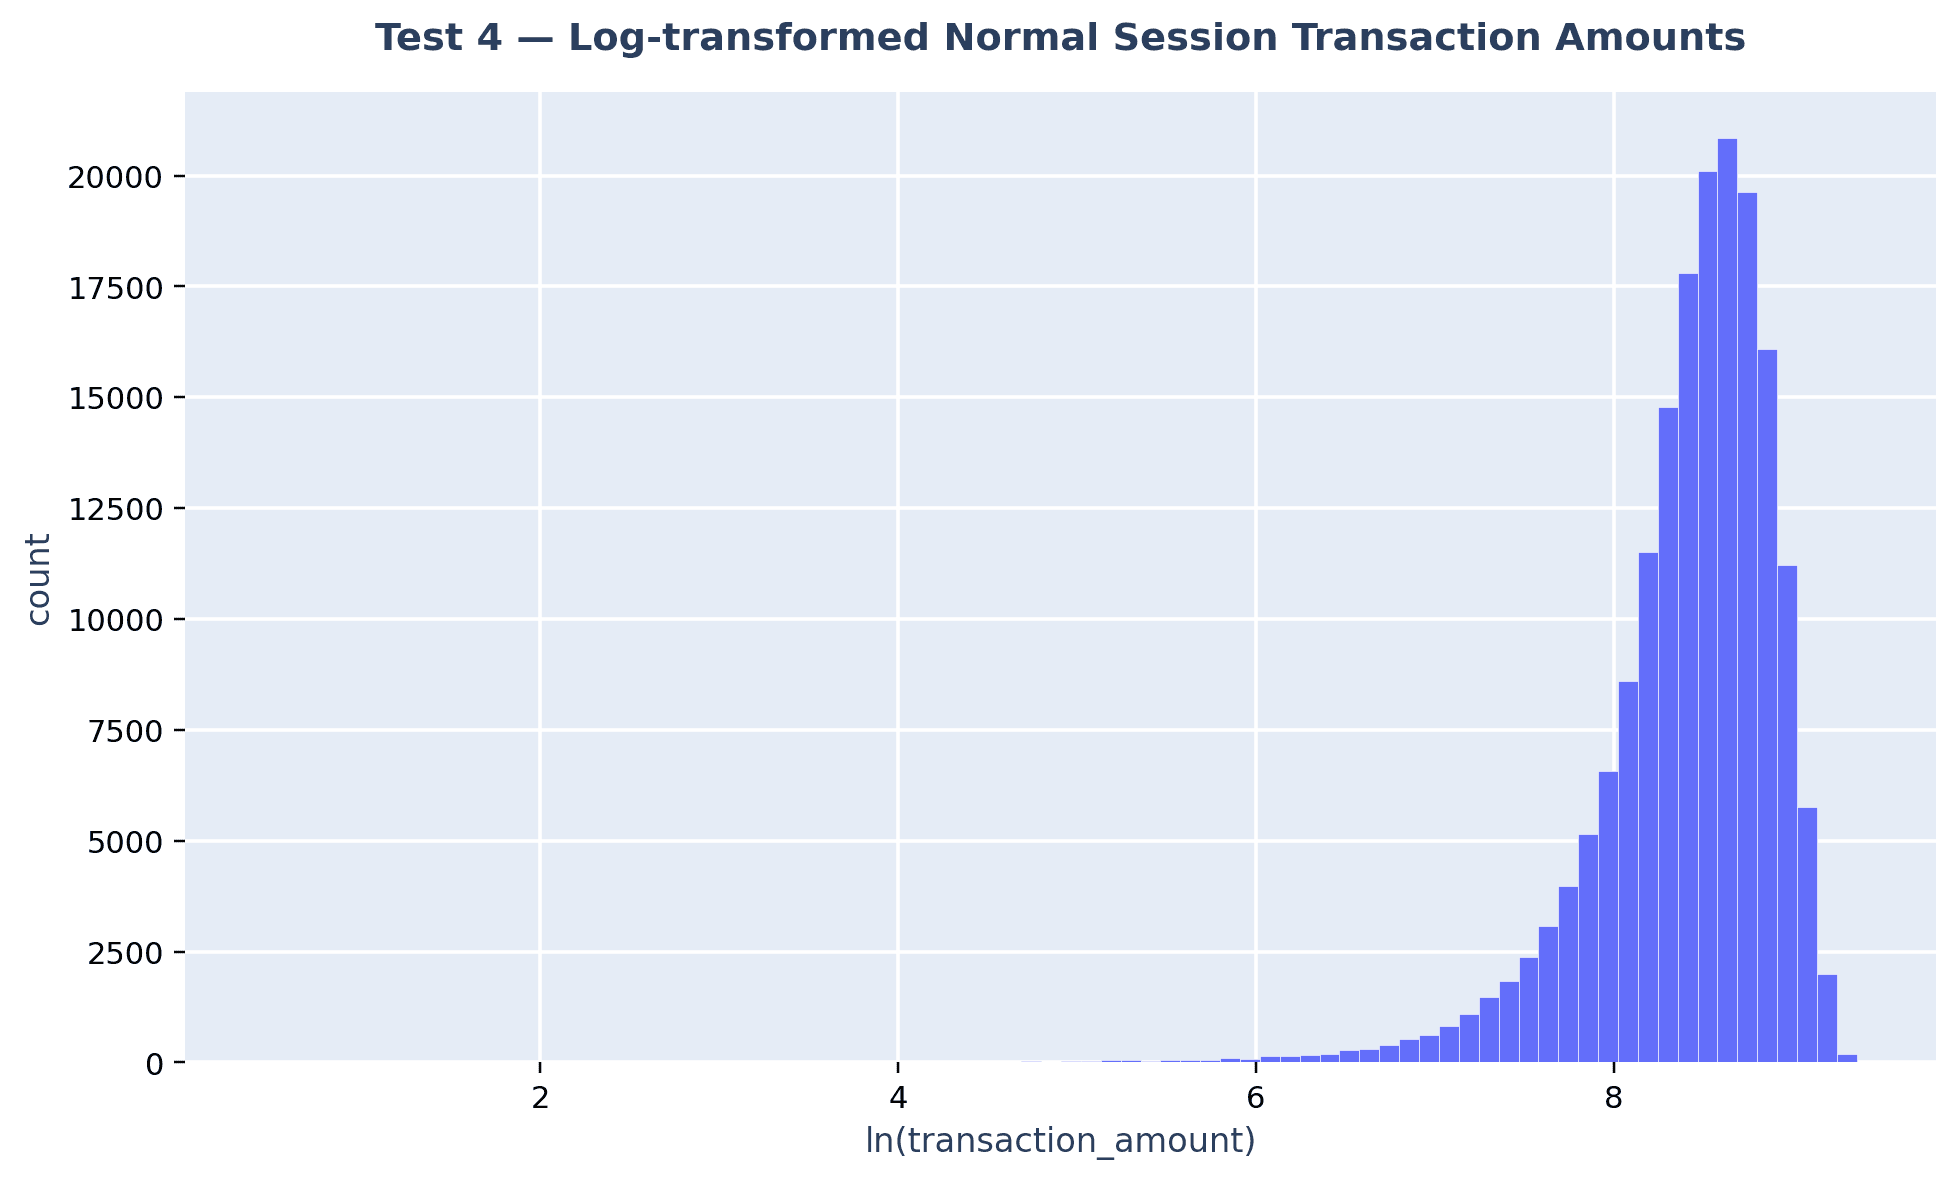
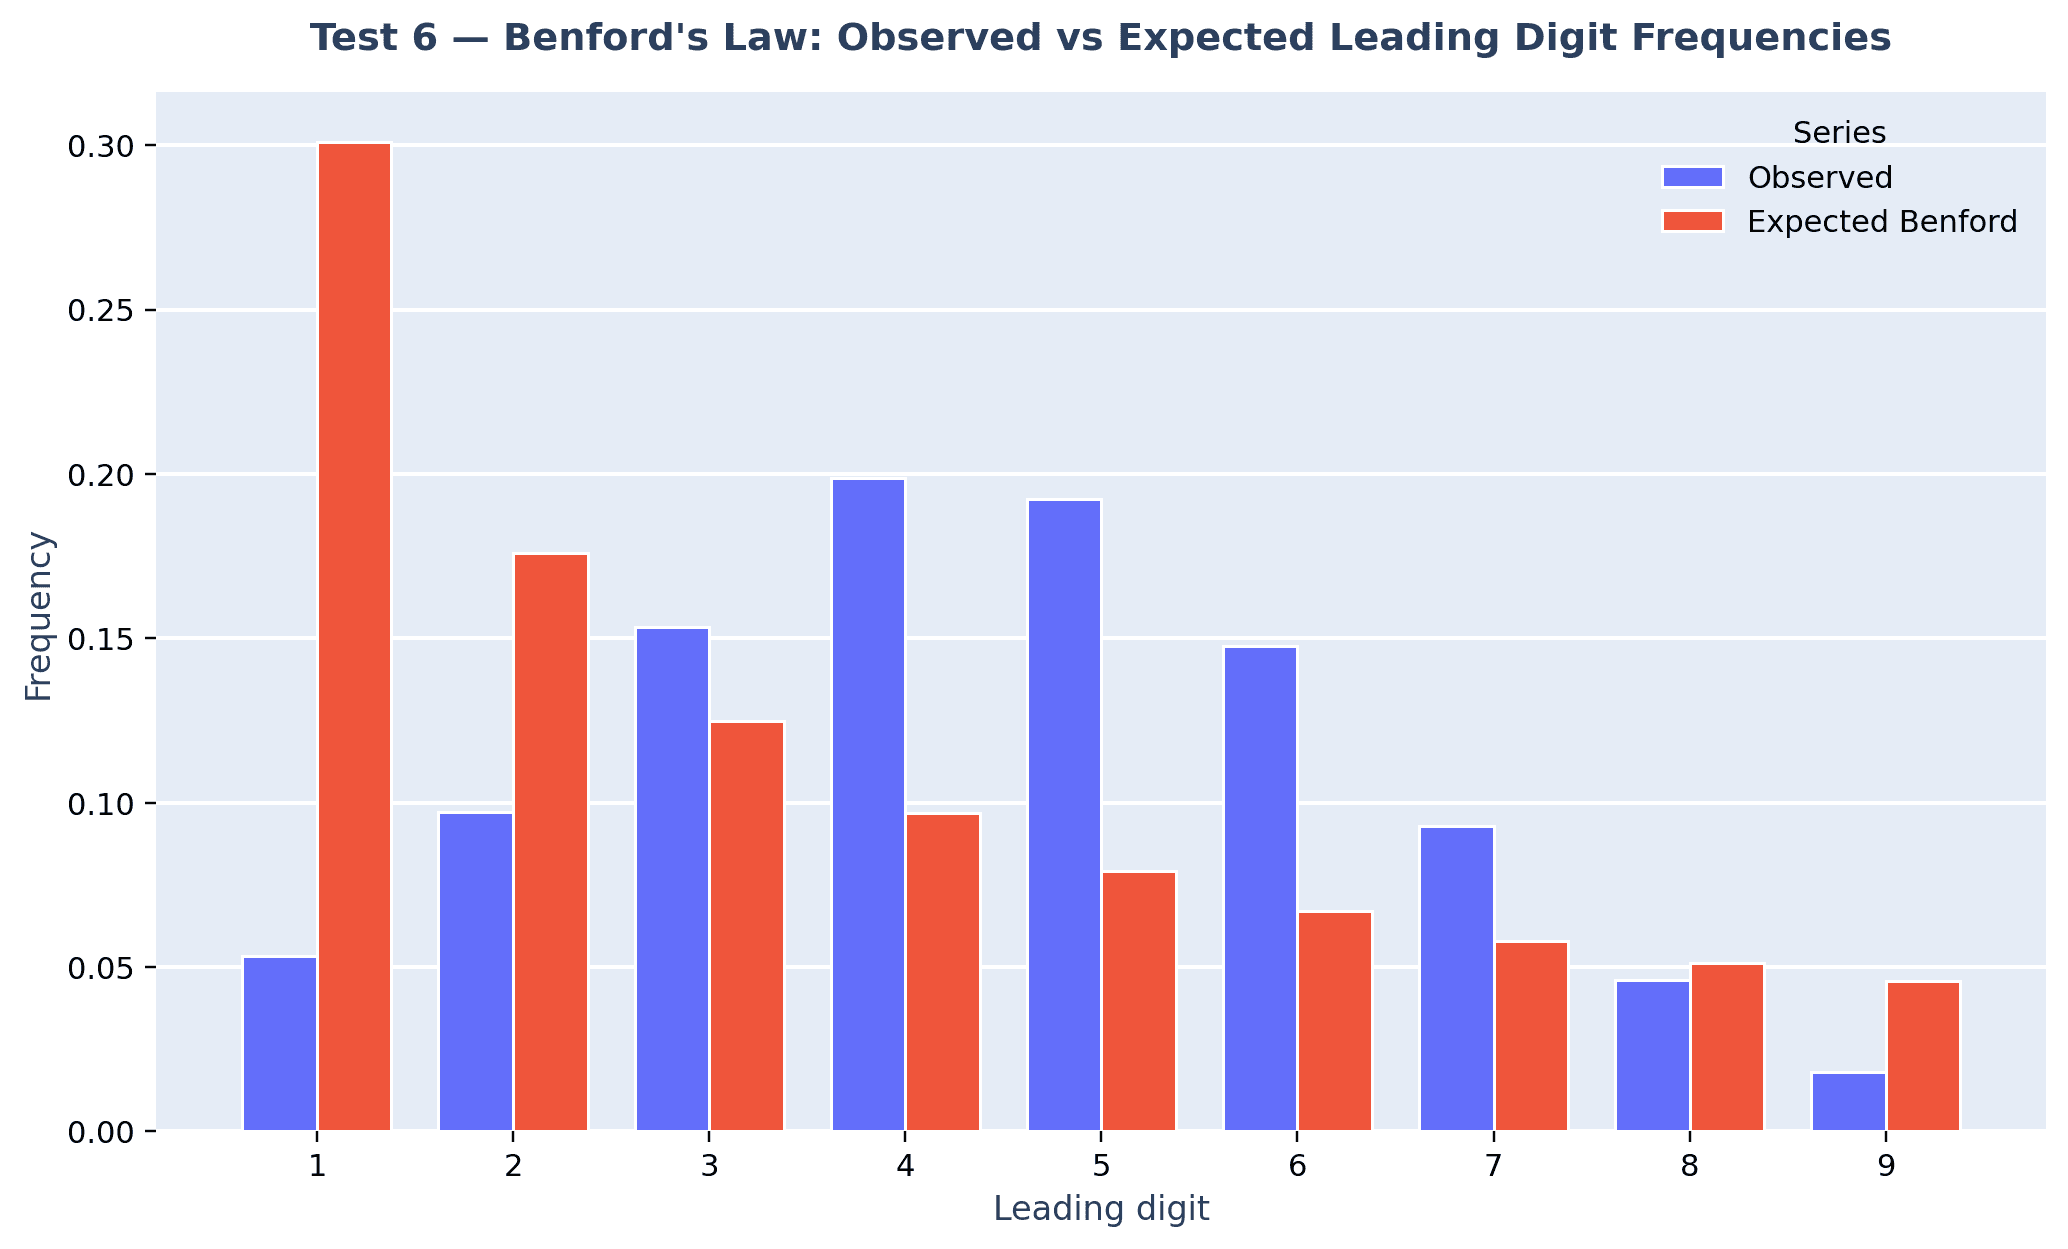
Net result: 3 of 6 tests passed. A structured plain-English interpretation of these results classified all three failures as "Non-critical — does not affect detection performance" rather than "Critical — threatens detection validity," on the reasoning that:
The detection approach relies on per-user deviation and attack separability (Tests 1, 2, and 5 — all of which passed), not on population-wide feature correlation structure or global amount-distribution shape.
Near-zero feature correlation (Test 3) and non-log-normal amounts (Test 4) are realism weaknesses in how "normal" sessions were generated, but do not by themselves prevent the deviation-based and Isolation Forest scoring approach from functioning.
Benford's Law (Test 6) is a convention more relevant to broad, unconstrained accounting/ledger data than to constrained consumer transaction amounts, and its failure has low relevance to a behavioral, per-user anomaly detection objective.
This distinction — critical vs. non-critical failure — is treated as the load-bearing judgment call in this document and is stated plainly rather than minimized: the dataset is defensible as fit-for-purpose for prototyping and stress-testing the detection pipeline's mechanics, but its statistical limitations mean it should not be cited as evidence that the pipeline will perform at these exact metrics against real transaction data (see Sections 8 and 10).
6.5 Reproducibility
All random-seeded steps (Isolation Forest training, Shapiro-Wilk sampling) used fixed random_state values (42 and 722126 respectively) and are reproducible given the same input CSVs. All intermediate outputs — baselines, splits, feature tables, scored datasets, evaluation metrics, and validation reports — were saved to a dated workspace output directory at each stage, preserving a complete, inspectable audit trail from raw dataset to final evaluated model. The synthetic dataset generation script itself is not reproduced in this document but is available on request for methodological review.
7. Use Case Walkthrough
7.1 Description of the Use Case
This walkthrough demonstrates the ATO Early Warning Agent operating end-to-end against the synthetic session dataset: from raw session data, through per-user baselining and dual anomaly scoring, to a tiered alert with a plain-English explanation an analyst could act on directly. The goal is to show not just that the pipeline produces a number, but that the number is traceable back to specific, human-interpretable behavioral evidence.
7.2 Input Data or Scenario
The scenario uses ato_synthetic_dataset_v2.csv: 180,000 sessions across 1,000 synthetic users over a 180-day window, with 522 attack sessions injected into days 130–179. Each session record carries user_id, day, hour_of_day, day_of_week, device_id, city, session_duration, transaction_amount, and the ground-truth is_attack label (used only for evaluation, never as a model input).
Before any modeling, the dataset's basic shape and distributions were confirmed:
180,000 rows, 9 columns, zero missing values in any column.
1,000 unique users, 1,522 unique devices, 7 unique cities.
Class distribution: 179,478 normal sessions (99.71%) vs. 522 attack sessions (0.29%) — a 343:1 imbalance.
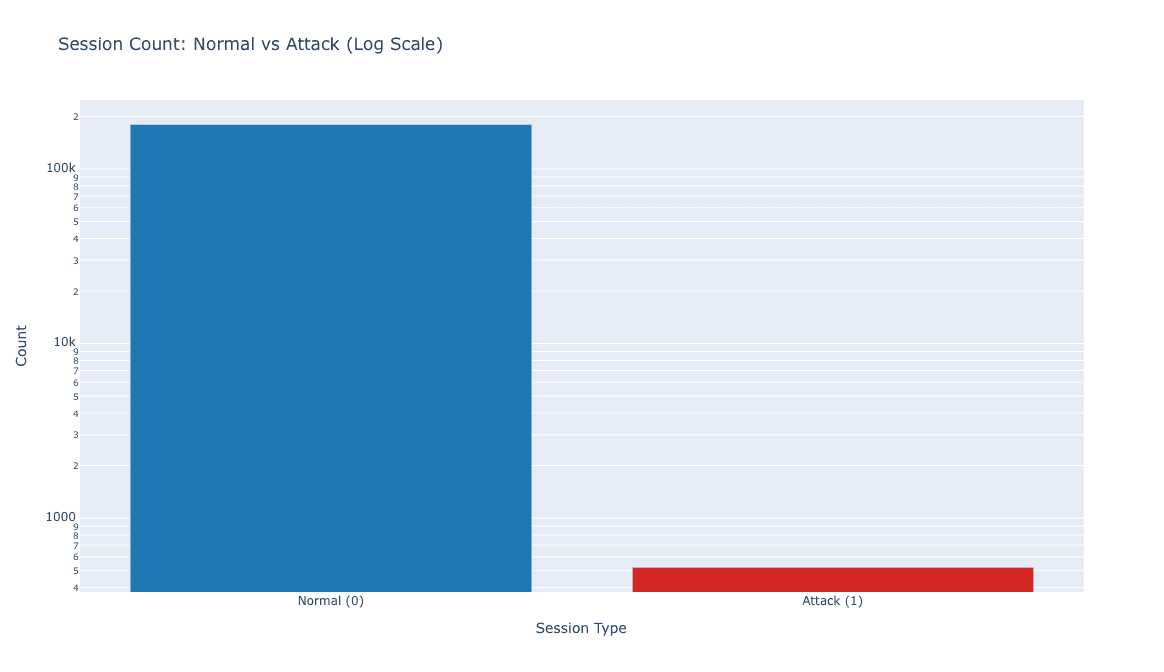
Exploratory distributions across the two classes made the shape of the detection problem visible before any model was built:
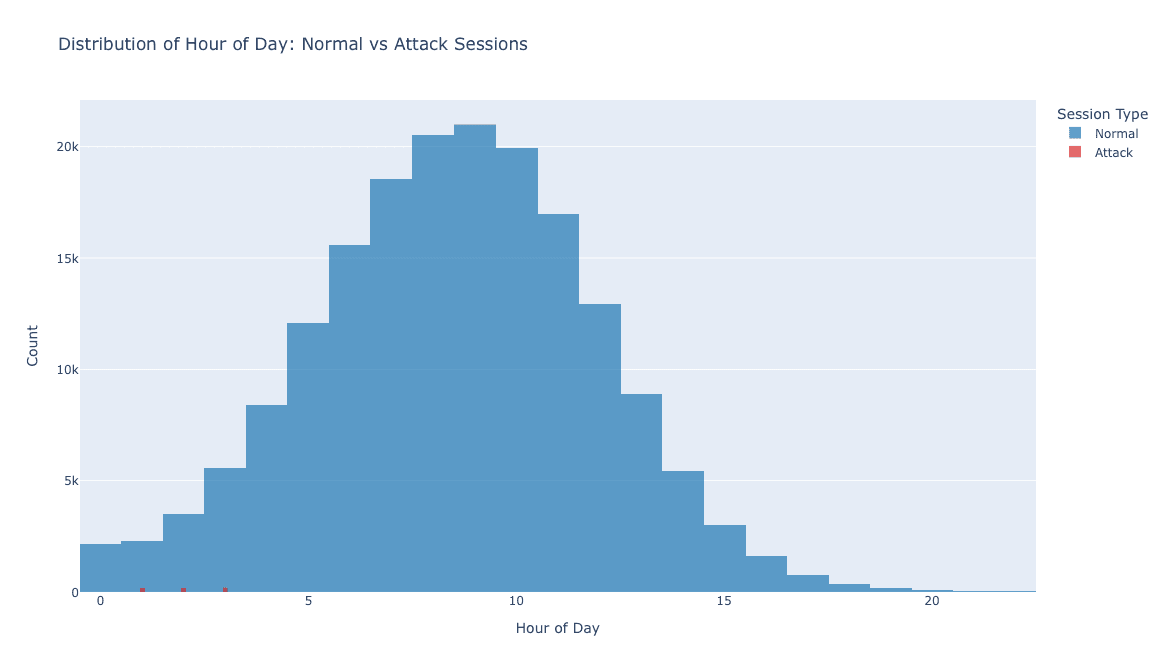
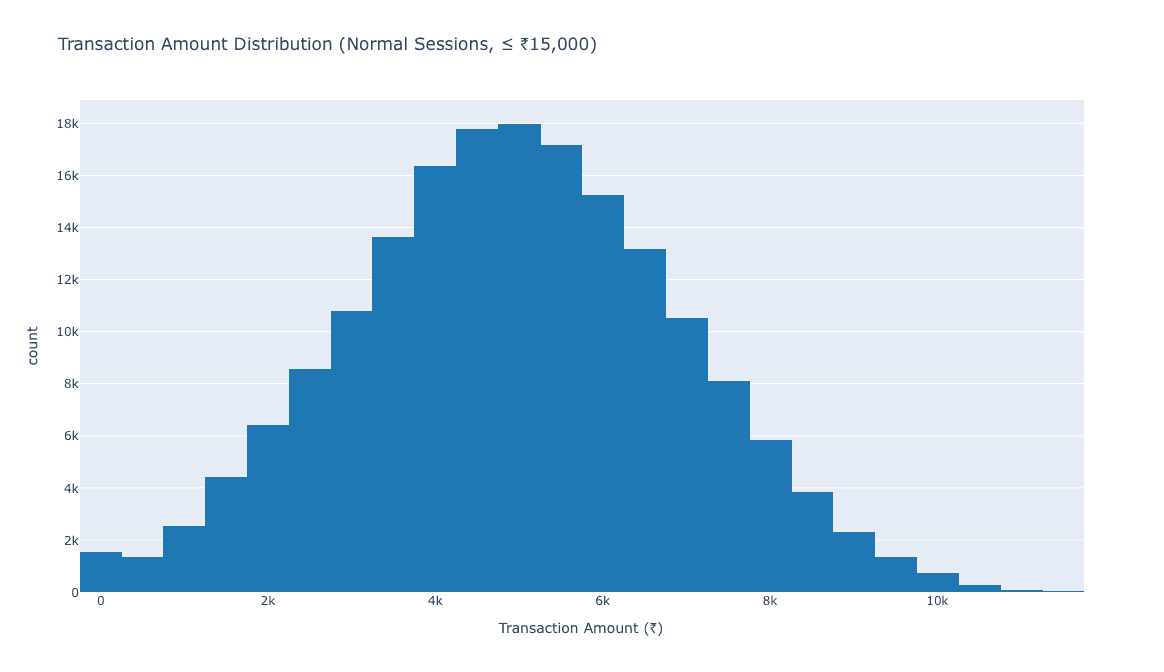
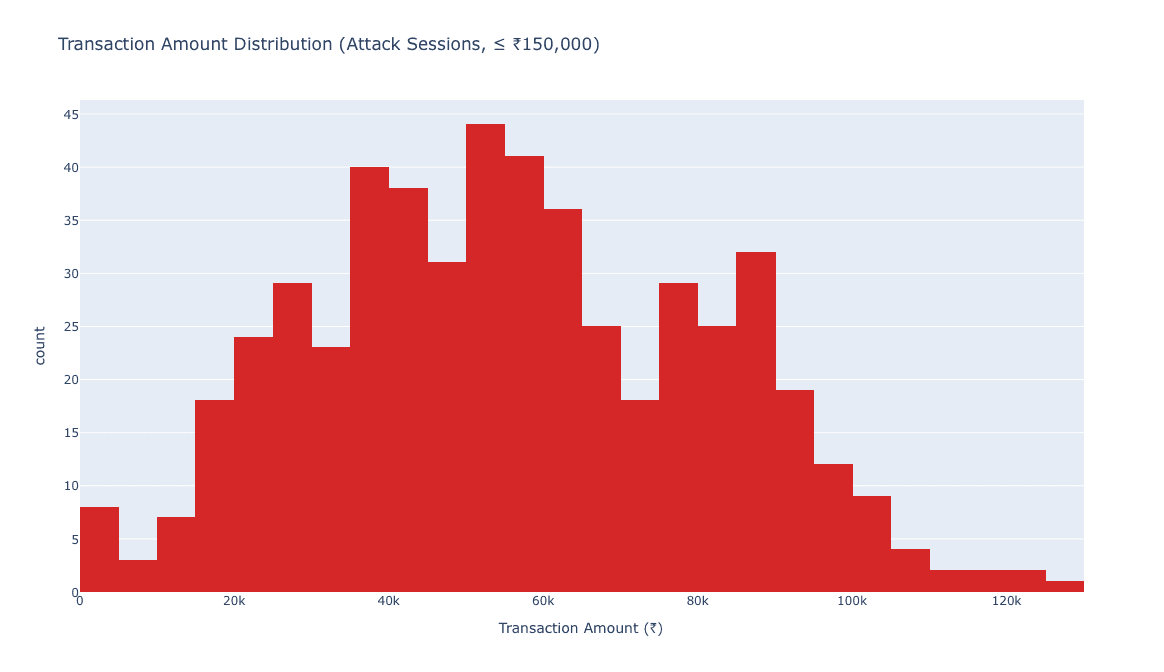
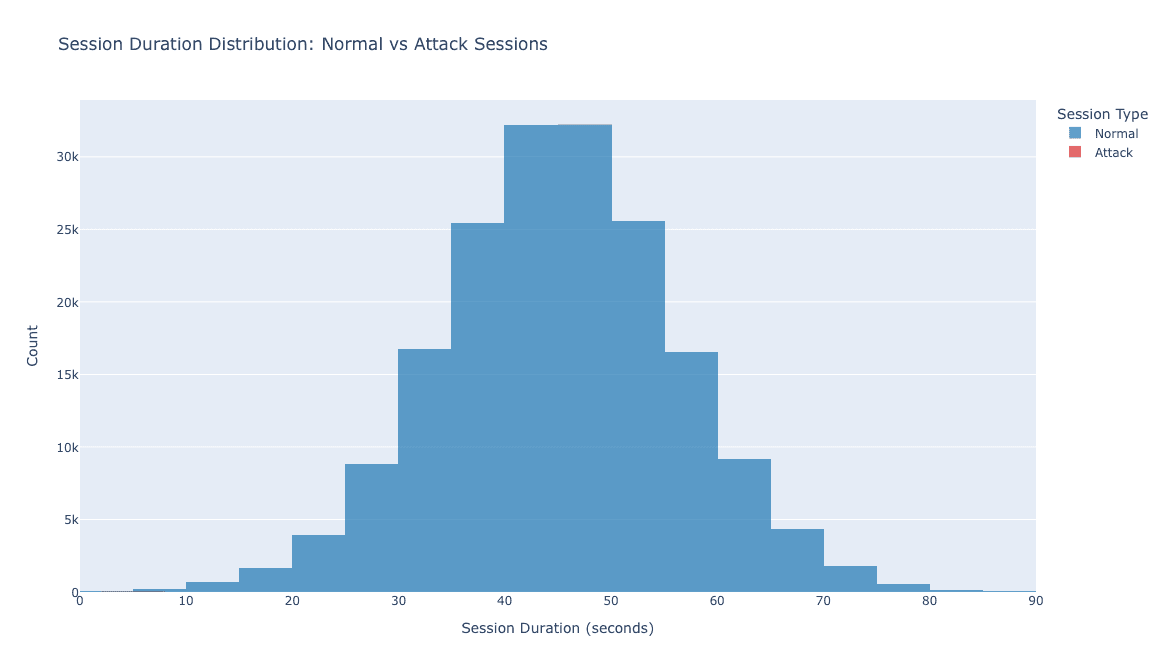
Even at this exploratory stage, attack sessions visibly skew toward unusual hours, much larger transaction amounts, and markedly shorter session durations than normal sessions — consistent with the intuition that a takeover session is typically a fast, opportunistic extraction rather than a leisurely browsing session.
7.3 Walkthrough of the Pipeline in Action
Step 1 — Establish the baseline. For user U0000, the training-period baseline (days 0–119, normal sessions only) computed: a mean login hour of 10.14 (σ = 1.63), a mean transaction amount of ₹4,762.36 (σ = 397.45), a mean session duration of 50.63 minutes (σ = 4.78), a home city of Guwahati, and a primary device of DEV-0000-6734.
Step 2 — Score an incoming session. On day 120 (the first day of the test period), user U0000's session had an hour of 9, amount of ₹4,835.52, and duration of 51.54 minutes, from their usual device and city. Every deviation feature was small (hour_deviation = 0.70, amount_deviation = 0.18, duration_deviation = 0.19, is_new_device = 0, is_new_city = 0), producing a negligible combined_score of 0.024 and an alert level of Low — correctly recognized as normal behavior.
Step 3 — Score an attack session. On day 140, the same user's account produced a session at hour 2 (versus their typical hour of ~10), a transaction of ₹64,406 (versus their typical ~₹4,762), a session lasting only 7.42 minutes (versus their typical ~51 minutes), from an unrecognized device, in an unrecognized city (Hyderabad). This session's combined risk score reached 0.85, correctly classified as High alert.
7.4 Output and Interpretation
The pipeline's explanation engine converted the day-140 session's risk score into a rule-based, plain-English rationale an analyst can act on without inspecting raw logs:
"Session flagged for user U0000 on day 140. Risk score: 0.85. Alert level: High. Reasons: Login hour is 2 which is 5.0 standard deviations from this user's normal login time of 10.1, Transaction amount of ₹64406 is 150.1 standard deviations from this user's normal amount of ₹4762, Session duration of 7.42 minutes is 9.0 standard deviations from this user's normal duration of 50.6 minutes, Login from an unrecognised device, Login from an unrecognised city Hyderabad."
This single explanation demonstrates the core value proposition of session-level, per-user detection: every reason cited is specific to this user's own history, not a population-wide threshold — the same ₹64,406 transaction might be entirely unremarkable for a different, higher-spending user, but is a 150-standard-deviation outlier for this one. Across the full test set, 572 sessions received a High or Medium alert with an explanation generated in this format (Section 6.4), and the aggregate evaluation of this scoring approach is presented in full in Section 8.
8. Results and Evaluation
8.1 Evaluation Setup
All results in this section are computed on the held-out test set: 60,000 sessions across 1,000 users (days 120–179), containing 522 ground-truth attack sessions, entirely unseen during training. The Isolation Forest was trained exclusively on the 120,000 normal-only training sessions (days 0–119); the deviation-scoring baselines were likewise computed only from that training window. combined_alert_level (High or Medium = predicted attack, Low = predicted normal) is evaluated against the ground-truth is_attack label.
8.2 Confusion Matrix
| Predicted Attack (High/Medium) | Predicted Normal (Low) | |
|---|---|---|
| Actual Attack | TP = 522 | FN = 0 |
| Actual Normal | FP = 50 | TN = 59,428 |
8.3 Performance Metrics
Precision: 0.9126
Recall: 1.0000
F1 Score: 0.9543
F2 Score: 0.9812
False Positive Rate: 0.0008
False Negative Rate: 0.0000
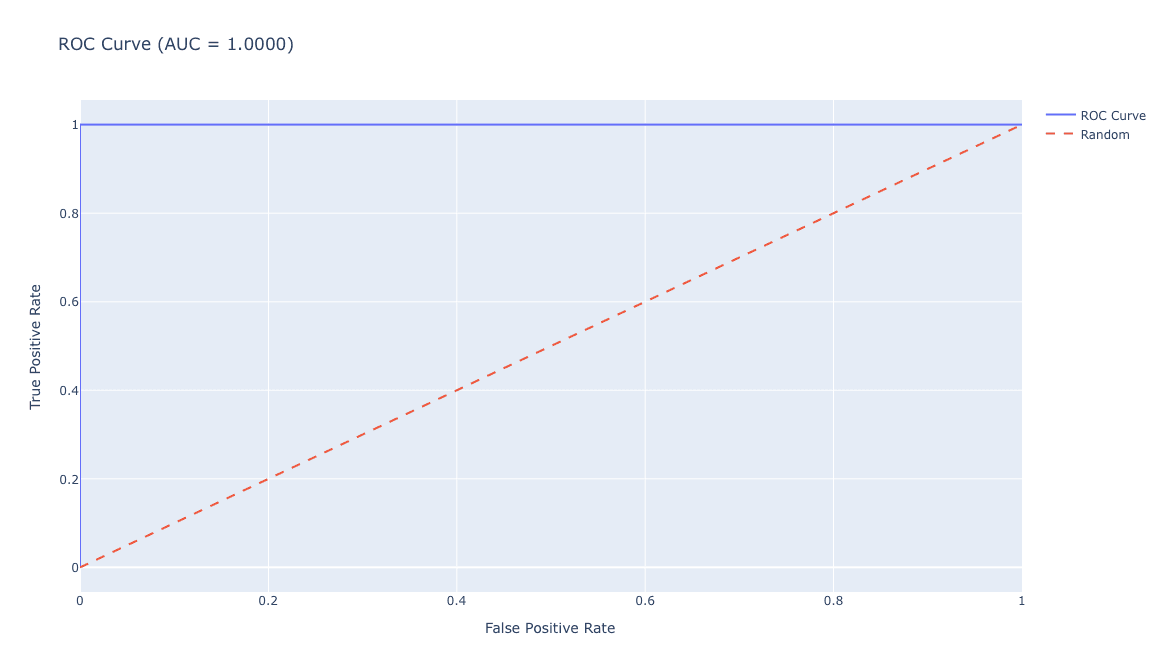
AUC-ROC: 1.0000
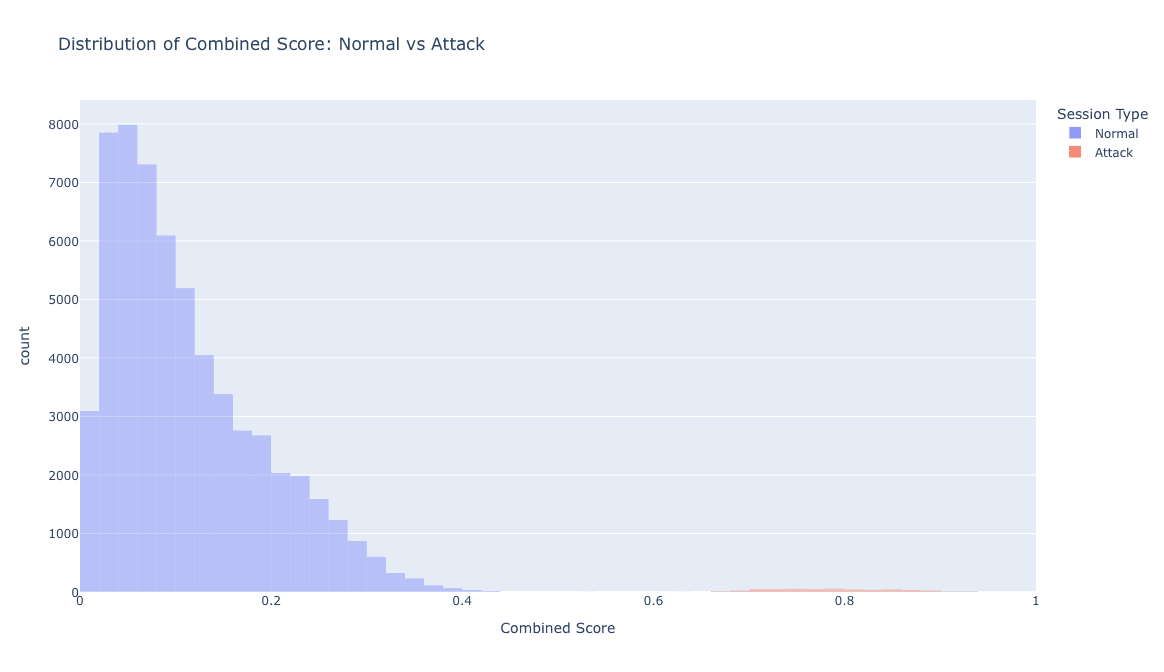
8.4 Interpretation
Every attack session was detected (Recall = 1.0, FN = 0). No injected attack in the 60,000-session test set went unflagged. This is the headline result, but it must be read alongside Section 6.4 and Section 10: a dataset where attacks are this cleanly separable from normal behavior may be easier to detect than real-world ATO attempts, where attackers actively try to blend into a victim's normal pattern. Recall = 1.0 on synthetic data is evidence the pipeline's mechanics work correctly, not a forecast of real-world recall.
False positives were low but non-zero (FP = 50, FPR = 0.08%). Of 59,478 genuinely normal sessions, 50 were flagged — typically sessions falling near a user's own behavioral boundary (e.g., a slightly later-than-usual login combined with a modestly larger transaction). This is a favorable false-positive rate for an alert-fatigue-sensitive fraud operations context, though again should be treated as a synthetic-data floor rather than a production guarantee.
Precision (0.9126) reflects that roughly 9 in 10 flagged sessions were true attacks, a manageable review load for a fraud operations team, especially combined with the plain-English explanation layer (Section 7.4) that lets an analyst triage each alert in seconds rather than minutes.
8.5 Efficiency Considerations
No cost-per-alert or analyst-hours baseline exists yet for this synthetic system, since it has not been deployed against a live review queue. What can be stated directly from the pipeline's own output: of 60,000 test sessions, only 572 (0.95%) required any analyst attention at all (High or Medium alert), each accompanied by a specific, pre-generated rationale — a substantial reduction in review surface area compared to a naive "review every session above a population-wide transaction threshold" approach, which would not have access to any of the personalized deviation signals this pipeline surfaces.
9. Comparison with Alternatives
9.1 Basis for Comparison
This section compares the per-user, session-level approach built on Terno AI against the three alternative approaches described in Section 3: static rule-based access controls, population-level transaction fraud models, and manual fraud operations review. The comparison is qualitative and structural — no head-to-head production benchmark exists yet, since this system has only been evaluated against synthetic data (Section 6.4, Section 10). Cost and performance figures below describe mechanism, not measured production outcomes.
9.2 Comparison by Dimension
Security (resistance to evasion)
Static rule-based access controls: Weak — fixed thresholds are learnable and evadable by attackers who study institutional patterns over time.
Population-level transaction fraud models: Moderate — effective against population-level anomalies, but structurally blind to a session that is unusual for one specific user while remaining unremarkable for the population.
Manual review: Depends entirely on analyst judgment and available context; not scalable as a primary control.
This approach (per-user baselining + Isolation Forest): Stronger against the specific evasion pattern of "blend into population norms" — a session must be consistent with both the specific user's own baseline and the broader normal-behavior model to avoid detection.
Performance (detection at the intended point in the user journey)
Static rule-based access controls: Detects only what the rules explicitly encode; no adaptation to individual behavior.
Population-level transaction fraud models: Detects primarily at or after the transaction, missing the session-access window entirely.
Manual review: Limited by review queue capacity and cannot scale with session volume.
This approach: Session-level scoring is available as soon as session features are observable, independent of whether a transaction occurs — enabling pre-transaction intervention (see Section 11 for production latency considerations).
Ease of Use / Explainability
Static rule-based access controls: Simple to understand individually, but large accumulated rule sets become difficult to reason about collectively.
Population-level transaction fraud models: Often produce a bare risk score without session-specific rationale.
Manual review: Requires an analyst to manually reconstruct the rationale from raw logs.
This approach: Every High/Medium alert is paired with a rule-based, plain-English explanation citing the specific behavioral deviations responsible (Section 7.4), reducing analyst triage time without requiring log-level investigation for routine cases.
Cost
Static rule-based access controls: Low direct compute cost, but high accumulated maintenance cost as rule sets grow and require ongoing tuning.
Population-level transaction fraud models: Moderate infrastructure cost; typically already-existing tooling at most institutions.
Manual review: Highest marginal cost — scales directly with analyst headcount and alert volume.
This approach: Prototype-stage compute cost is low (batch Isolation Forest training and scoring on the synthetic dataset completes in seconds); production cost depends on the eventual real-time deployment architecture (Section 11) and has not yet been measured.
9.3 Summary
The core differentiator is not raw detection accuracy in isolation — population-level and rule-based systems can also achieve high accuracy against the anomalies they are designed to catch — but the object being modeled. By scoring sessions against each user's own behavioral history rather than population-wide thresholds, this approach is structurally positioned to catch the specific failure mode (a session that looks fine at the population level but is anomalous for the account holder) that motivated this project in the first place (Section 2). This structural advantage is evidenced on synthetic data in Section 8; it has not yet been evidenced on production data, which is the recommended next validation step (Section 10).
10. Limitations and Considerations
10.1 Known Limitations
The dataset does not fully replicate real financial behavioral statistics. The six-test validation suite (Section 6.4) found 3 of 6 tests failing: near-zero correlation between behavioral features (real financial data typically shows some structure between amount, timing, and duration), non-log-normal transaction amounts, and non-conformance to Benford's Law. These were assessed as non-critical to the detection mechanism specifically (Section 6.4), but they are real limitations on how far the dataset's "normal" behavior can be trusted to resemble a real customer population.
Session duration is not calibrated to realistic banking session lengths. The dataset assumes a mean normal session duration of 45 minutes; real banking app/web sessions are commonly much shorter (3–6 minutes in published mobile session-length literature). This is an uncorrected gap in the current dataset version and should be revised before any claim of behavioral realism in session-length modeling specifically.
Attack sessions may be more cleanly separable than real ATO attempts. Recall = 1.0 and AUC-ROC = 1.0 (Section 8) indicate the injected attacks are statistically very distinct from normal sessions. Real attackers — particularly sophisticated ones — actively attempt to mimic legitimate behavior (session timing, device fingerprint spoofing, plausible transaction amounts) specifically to evade detection. The current dataset does not model this adversarial mimicry, so evaluation metrics on it should be treated as an upper bound, not an expected production result.
A directional, non-verified benchmark comparison was used to contextualize dataset realism. An internal comparison against "real financial transaction data" (see Appendix) was explicitly constructed as a stylized, directional reference — it is not sourced from a proprietary or published dataset and should not be cited as verified external benchmark data in any external-facing version of this document. Where harder evidence is needed, published, citable sources should replace it.
The feature set is intentionally narrow. The current model uses only hour-of-day, transaction amount, and session duration, plus device/city match flags. It does not yet incorporate device fingerprinting, behavioral biometrics (typing cadence, mouse/touch patterns), network/IP reputation, or graph-based signals (e.g., shared devices or destinations across accounts) — all of which are common in mature ATO detection systems and are planned as roadmap items (Section 11).
The explanation engine is rule-based, not learned. Explanations are generated from fixed thresholds (e.g., "deviation > 2 standard deviations") rather than a model that learns which combinations of signals are most informative. This keeps explanations transparent and auditable but may not surface more subtle multi-feature interaction patterns a learned explainability layer (e.g., SHAP values, see Section 11) could capture.
No production or live-data validation has been performed. Every result in this document is derived from the synthetic dataset. The appropriate next step (Section 11) is shadow deployment against real session data — running the model passively alongside existing controls, without acting on its outputs, to observe how its metrics hold up against genuine behavioral variability and adversarial evasion attempts.
10.2 Edge Cases
New or low-history users. A baseline computed from too few sessions (the current design assumes a full 120-day training window) will be statistically unreliable for genuinely new accounts — a cold-start problem not yet addressed.
Shared devices and joint/family accounts. Multiple legitimate users transacting under one account will violate the single-user-baseline assumption, potentially generating false positives for legitimate secondary users.
Legitimate behavioral shifts. Travel, a new job with different hours, or a new personal device are all legitimate reasons a real user's behavior might deviate sharply from their own baseline — the current design does not distinguish these from an actual takeover.
Business or high-transaction-variance accounts. Accounts with inherently variable transaction patterns (e.g., small business accounts) may not fit the "consistent personal routine" assumption underlying the baseline approach as well as typical retail consumer accounts.
10.3 Scenarios Where This Approach May Be Suboptimal
Newly opened accounts without sufficient training-period history.
Accounts with intentionally variable, non-routine usage patterns (e.g., business accounts, accounts used primarily while traveling).
Environments where device/location signals are inherently noisy (e.g., heavy VPN usage, corporate shared IP ranges) and would need additional signal weighting or suppression logic not yet implemented.
11. Future Work
11.1 Immediate Next Step: Shadow Deployment
Before any further feature expansion, the highest-priority next step is shadow deployment: running the current pipeline passively against real session data, alongside existing controls, without acting on its outputs. This is the only way to test whether the synthetic-data evaluation metrics (Section 8) hold up against genuine behavioral variability, legitimate edge cases (Section 10.2), and real (rather than injected) attack patterns.
11.2 Dataset Revision
Independent of shadow deployment, the synthetic dataset itself should be revised to address the limitations identified in Section 6.4 and 10.1 — most concretely, recalibrating session duration to the realistic ~3–6 minute range, and introducing deliberate mild correlation structure between behavioral features rather than near-independent generation.
11.3 Signal Expansion
Device fingerprinting — richer device identity signals beyond a simple device ID match/mismatch flag.
Behavioral biometrics — typing cadence, touch/mouse interaction patterns, and other continuous behavioral signals.
Network graph analysis — shared devices, IPs, or destination accounts across users, to catch coordinated fraud rings rather than only single-account anomalies.
11.4 Explainability for Regulatory Compliance
The current rule-based explanation engine (Section 7.4) should be extended with model-native explainability outputs (e.g., SHAP values) for the Isolation Forest component specifically, giving both an interpretable, rule-based summary for analysts and a rigorous, model-faithful attribution for regulatory or audit purposes.
11.5 Feedback Loop and Human-in-the-Loop Workflows
A labeled feedback loop with fraud operations teams — capturing analyst dispositions on flagged sessions — would allow the deviation thresholds and combined-scoring weights (currently fixed at 0.7/0.3 and 0.5/0.5, Section 5) to be tuned against real outcomes rather than fixed a priori. This should be paired with formal human-in-the-loop review workflows for High-alert sessions before any automated action (e.g., session termination, step-up authentication) is taken.
11.6 Production Readiness: Latency, Load, and Drift
Load and latency optimization for real-time or near-real-time scoring conditions, rather than the current batch-oriented prototype.
Drift monitoring with scheduled retraining, since both the Isolation Forest and per-user baselines will degrade as genuine behavior shifts over time.
Multi-channel coverage, extending beyond a single session-event schema to cover mobile, web, and API-initiated sessions consistently.
11.7 Integration Architecture
Three integration patterns should be evaluated for production deployment, each with different latency and use-case tradeoffs:
Inline/synchronous — sub-second scoring during the authentication or payment flow itself, enabling real-time step-up authentication or session blocking.
Asynchronous/event-streaming — a Kafka/Kinesis-style pipeline generating analyst alerts without blocking the user's live session.
Hybrid — synchronous scoring for the highest-confidence signals (e.g., new device + new city) combined with asynchronous scoring for the fuller feature set.
Any of these would sit upstream of a downstream decisioning layer (determining what action a given alert tier triggers) and should integrate with existing SIEM and case management systems rather than operating as an isolated tool.
12. Conclusion
Account takeover is a distinct threat from transaction-level fraud, requiring detection at the session level, against a specific user's own behavioral history, rather than against population-wide thresholds applied after a transaction has already begun. This white paper has documented the design, build, and evaluation of a prototype ATO Early Warning Agent built end-to-end on Terno AI, combining per-user statistical baselining with an Isolation Forest anomaly model and a plain-English explanation layer, to produce alerts that are both accurate and immediately actionable by a fraud analyst.
On the synthetic test set, the pipeline achieved a recall of 1.0 (zero missed attacks), a precision of 0.9126, and an AUC-ROC of 1.0 — results that demonstrate the pipeline's mechanics are sound and the architecture is viable. Equally important to this document's credibility, however, is what these results do not show: a rigorous, independent six-test statistical validation of the synthetic dataset itself found real limitations (near-zero feature correlation, non-log-normal transaction amounts, non-conformance to Benford's Law, and an uncorrected session-duration assumption), and the injected attacks are very likely more statistically distinct from normal behavior than real, adversarially evasive ATO attempts would be. These limitations are stated directly in Section 10 rather than minimized, because the intended audience for this document needs to evaluate the strength of the underlying evidence, not just its favorable topline numbers.
The recommended path forward is not further synthetic-data tuning, but shadow deployment against real session data — the only validation step that can confirm whether this architecture's strong synthetic performance translates to genuine production reliability. Pending that validation, this project should be understood as a well-evidenced, architecturally sound prototype: a credible basis for continued investment, not yet a production-ready system.
13. References
The following sources were used as directional, principle-grounding references during dataset construction and are cited here for methodological transparency. Full bibliographic details (publisher, exact page/section references) should be verified and completed before external circulation of this document.
- Glasser, J., & Lindauer, B. (2013). Bridging the Gap: A Pragmatic Approach to Generating Insider Threat Data. — Referenced as methodological precedent confirming the CERT Insider Threat Dataset is constructed from artificially designed scenarios rather than real employee data, supporting the decision to build a purpose-built synthetic dataset for this project.
- Reserve Bank of India. Annual Report, FY2023–24. — Referenced for general context on transaction-value magnitudes in an Indian retail banking setting.
- Böhmer, M., et al. — Referenced for general context on mobile application session-length patterns.
- Localytics. Mobile App Engagement/Usage Data. — Referenced for general context on mobile session-duration benchmarks.
No other external sources were cited with specific statistics in this document. The internal benchmark comparison in the Appendix is explicitly not drawn from these or any other verified source and should not be treated as a citation.
Appendix
Terno AI Chat Session: https://supriya.app.terno.ai/chat/share/c0d757ba-e189-4bc3-bfdb-8b5f1cf89411?ui_version=v2
Dataset and other generated files through Terno AI session: https://drive.google.com/drive/folders/1moKTlR1H9AerQrtH8k2EPQrAbN5o4cez
A.1 Real Financial Transaction Benchmark Comparison (Internal, Non-Verified)
Important caveat: The comparison below was generated as an internal, stylized, directional reference — it is explicitly not sourced from any real or proprietary transaction dataset, and the numeric bands shown (e.g., "25%–60% typical") are analytical judgment, not cited external data. This table should not be presented to external or regulatory audiences as verified benchmark evidence. It is included here only to show the reasoning process used internally to contextualize the dataset validation results in Section 6.4.
Test 1 — Intra-user consistency
Dataset result: Pass (22.49% mean CV)
Stylized real-data expectation: commonly cited informally as ~25–60% CV
Internal assessment: slightly more regular than the stylized expectation, near the lower bound
Test 2 — Inter-user diversity
Dataset result: Pass (3.02 hours std. dev.)
Stylized real-data expectation: commonly cited informally as >3 hours, often 3–6 hours
Internal assessment: meets the lower edge of the stylized expectation
Test 3 — Feature correlation
Dataset result: Fail (max |r| = 0.022)
Stylized real-data expectation: some correlation commonly expected, roughly |r| = 0.05–0.30
Internal assessment: below the stylized expectation — features are more independent than typically assumed for real transaction data
Test 4 — Log-normality of transaction amounts
Dataset result: Fail (Shapiro-Wilk p ≈ 2.91 × 10⁻⁵⁴)
Stylized real-data expectation: global log-normality often fails at large sample sizes even in real, heterogeneous transaction data
Internal assessment: the failure is not necessarily unrealistic, but was not independently verified against real data
Test 5 — Statistical separability of attacks
Dataset result: Pass (all p < 0.001)
Stylized real-data expectation: real fraud/ATO separability is typically significant but noisier and less clean than this result
Internal assessment: exceeds the stylized expectation — likely easier than real-world separability (see Section 10.1)
Test 6 — Benford's Law
Dataset result: Fail (χ² = 116,106.31, p ≈ 0)
Stylized real-data expectation: Benford conformity is more associated with broad accounting/ledger data than constrained consumer transactions
Internal assessment: low relevance to the ATO detection objective specifically, but a large deviation nonetheless

10 September 2026
Designing CertusAI: A Compliance-First Enterprise LLM Platform for Regulated Industries
As enterprise adoption pivots from raw model parameter scale to verifiable trust, CertusAI introduces a compliance-first LLM architecture engineered specifically for highly regulated industries. By integrating real-time PII redaction, deterministic policy enforcement, and cryptographically signed audit chains directly into the inference pipeline, CertusAI unlocks agentic AI productivity while ensuring total data sovereignty and statutory compliance.

10 September 2026
E-Commerce Return Intelligence: Analyzing Return Drivers and Predicting Purchase-Time Return
Addressing reverse-logistics friction and return-rate costs in fashion e-commerce, this study leverages the 1.37M-record ASOS GraphReturns dataset to evaluate product, pricing, and country-level return drivers. Using Terno AI for structured analysis alongside a deployed Logistic Regression baseline, the platform provides purchase-time risk scoring to power relative risk ranking, operational prioritization, and non-punitive intervention pilots.

10 September 2026
Optimizing Schedule Integrity via Patient Appointment Intelligence
Most patient no-show models look impressive on paper until they hit production. By rejecting target leakage, confronting a heavy 90/10 class imbalance head-on, and moving beyond raw accuracy, we built a production-ready decision layer that converts raw risk probabilities into actionable clinical interventions.